Green spaces are not a luxury, but a necessity. Due to climate change, growing health issues, and declining biodiversity, we need to redesign our cities and towns. More trees and green spaces make neighborhoods more livable and future-proof. As a municipality, you play a key role in this. But how do you know if you’re on the right track? How do you make informed choices and ensure a fair distribution of green spaces? Prof. Dr. Cecil Konijnendijk’s 3+30+300 rule offers guidance. Read how to apply it within your municipality, what challenges you might face in practice, and how IMAGEM helps IMAGEM make data-driven decisions.
What is the 3+30+300 rule?
The 3+30+300 rule is a simple yet powerful guideline for greening residential areas, new construction plans, or redevelopment projects. It is not a standard, but a guiding goal that provides insight into the quality of the living environment. The method is based on three principles:
- At least three trees are visible from every home
- Every neighborhood has at least 30% tree canopy cover
- Every home is located within 300 meters of a public green space
By combining these principles, you can quickly gain insight into the current situation and identify opportunities and challenges. We’ll explain each one in detail below.
How the 3+30+300 rule works
Why the 3+30+300 rule?
3 trees
Everyone should be able to see at least three mature trees from their home, workplace, and school.
30% coverage
We should all live in neighborhoods with at least 30% tree canopy cover.
300 meters to green space
Everyone has access to green spaces in public areas within 300 meters of their home.
A view of three trees from every home
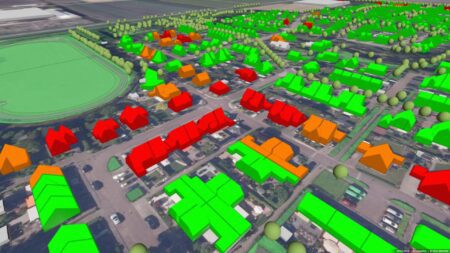
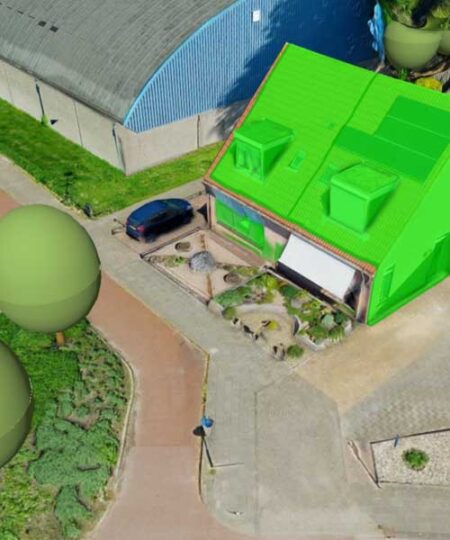
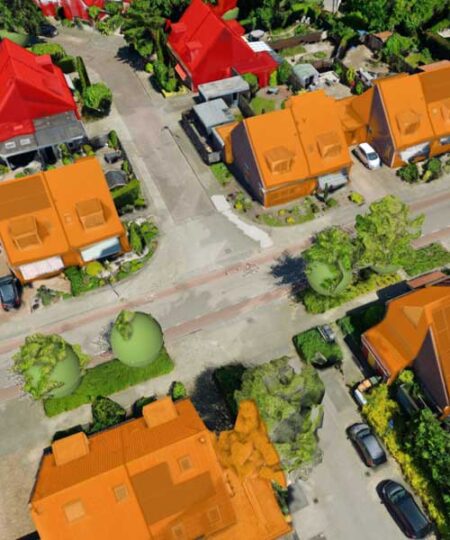
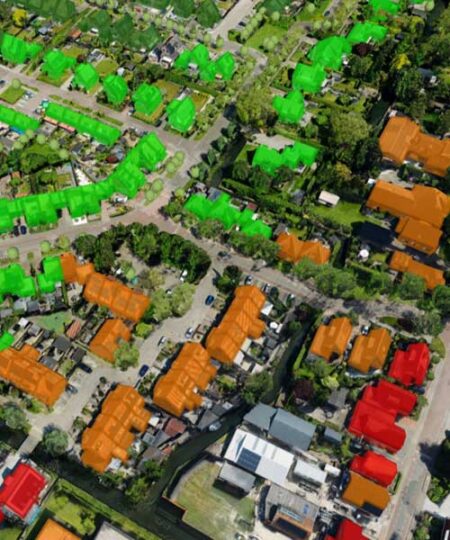
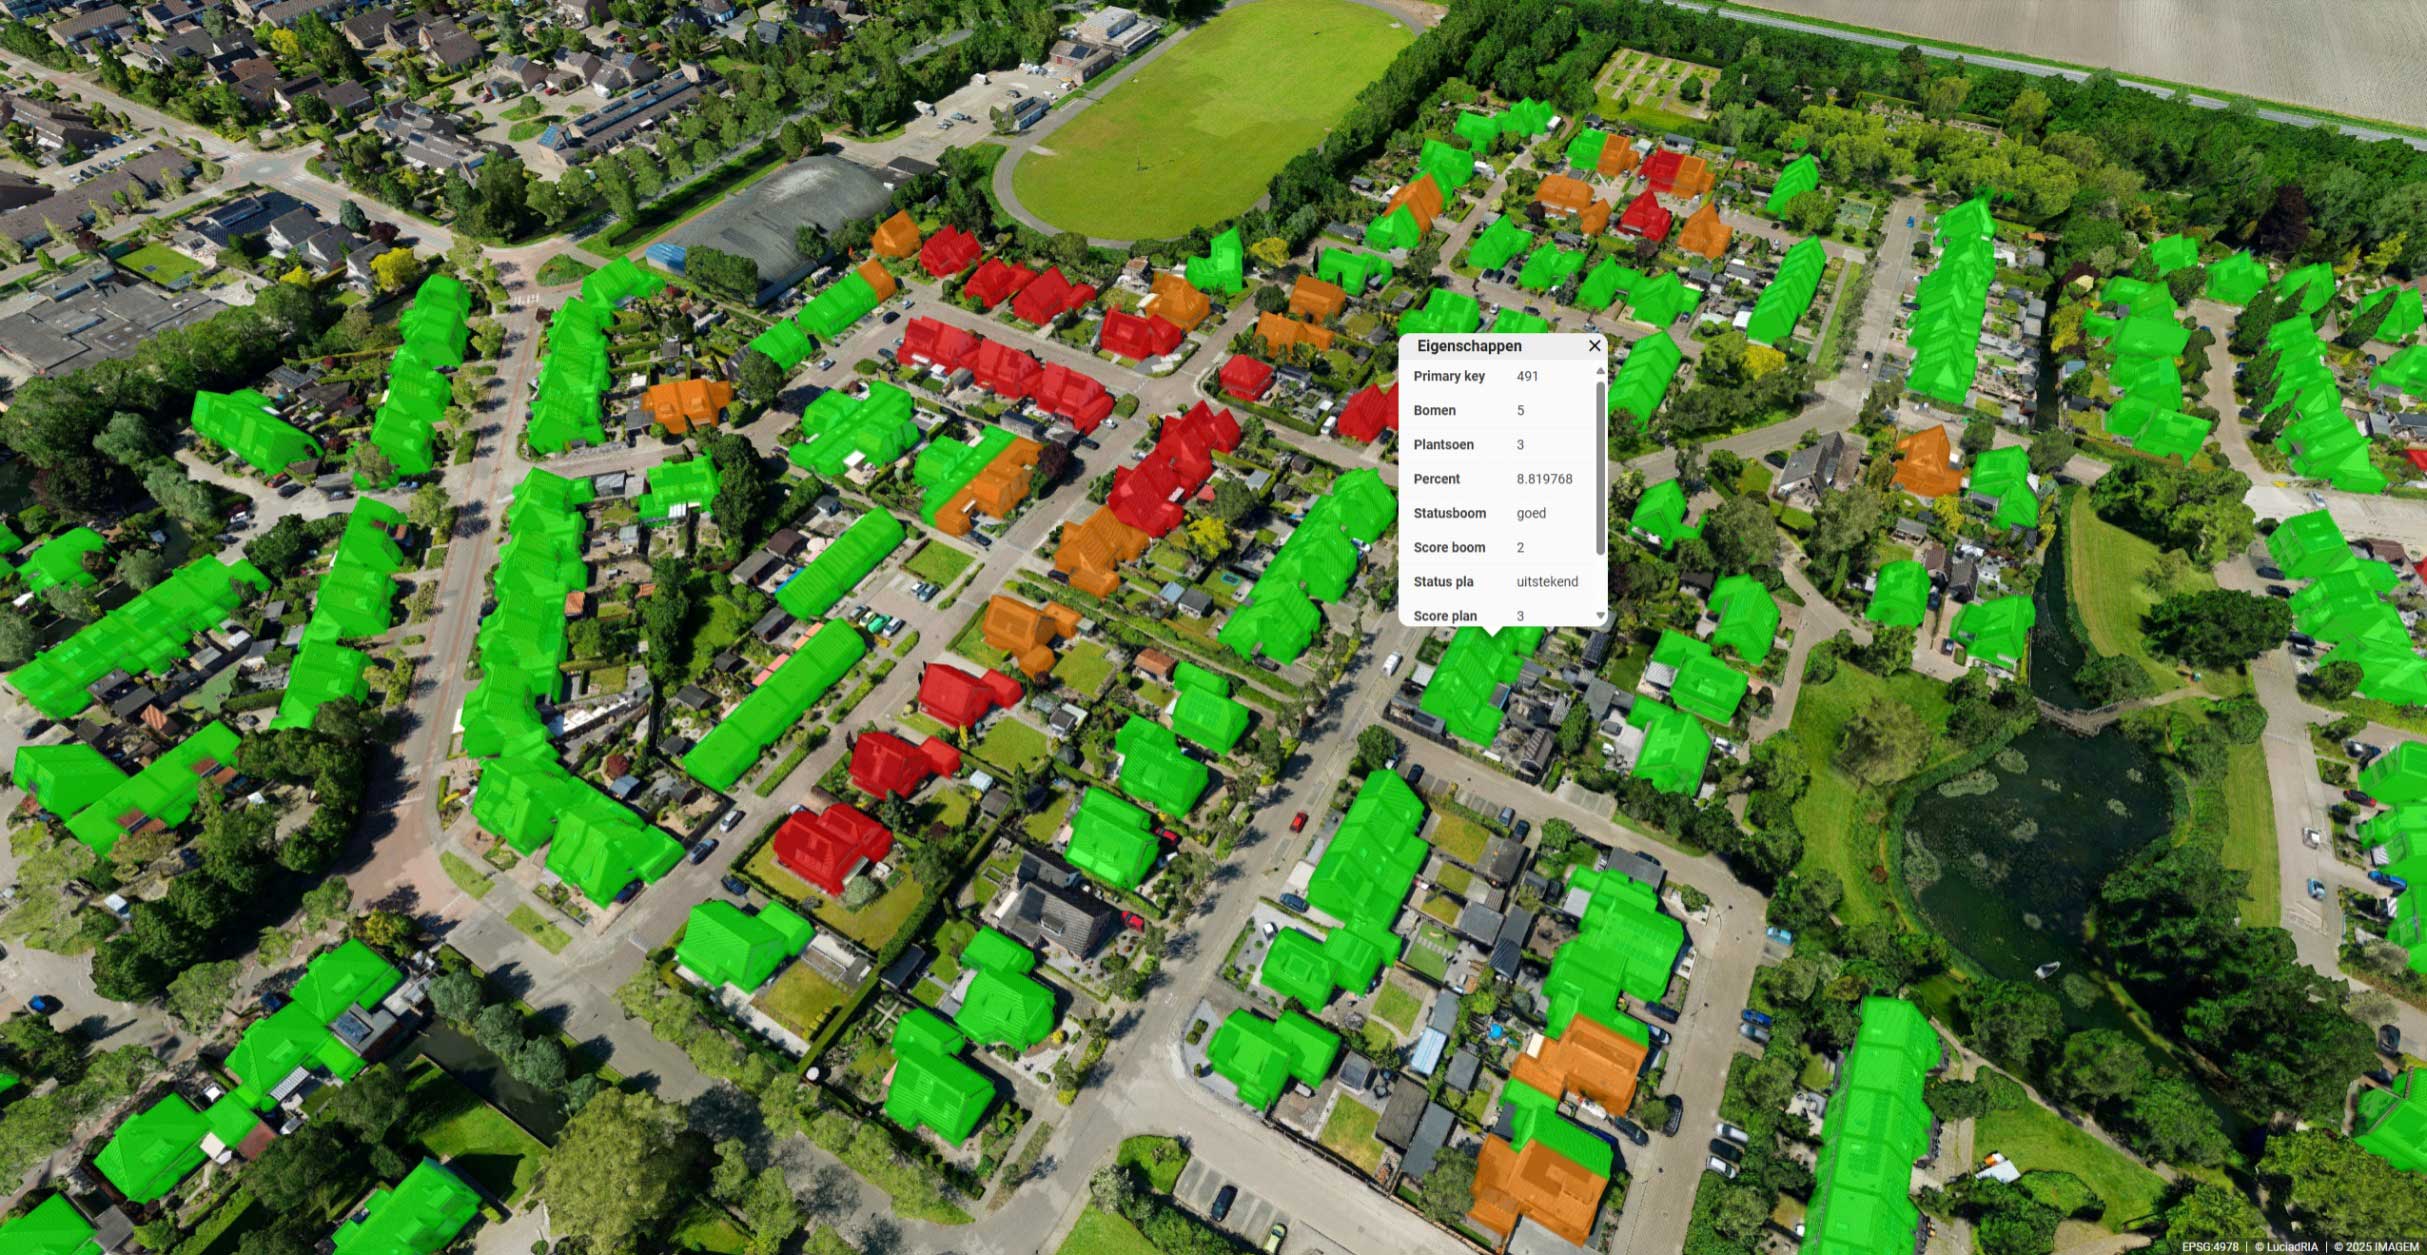
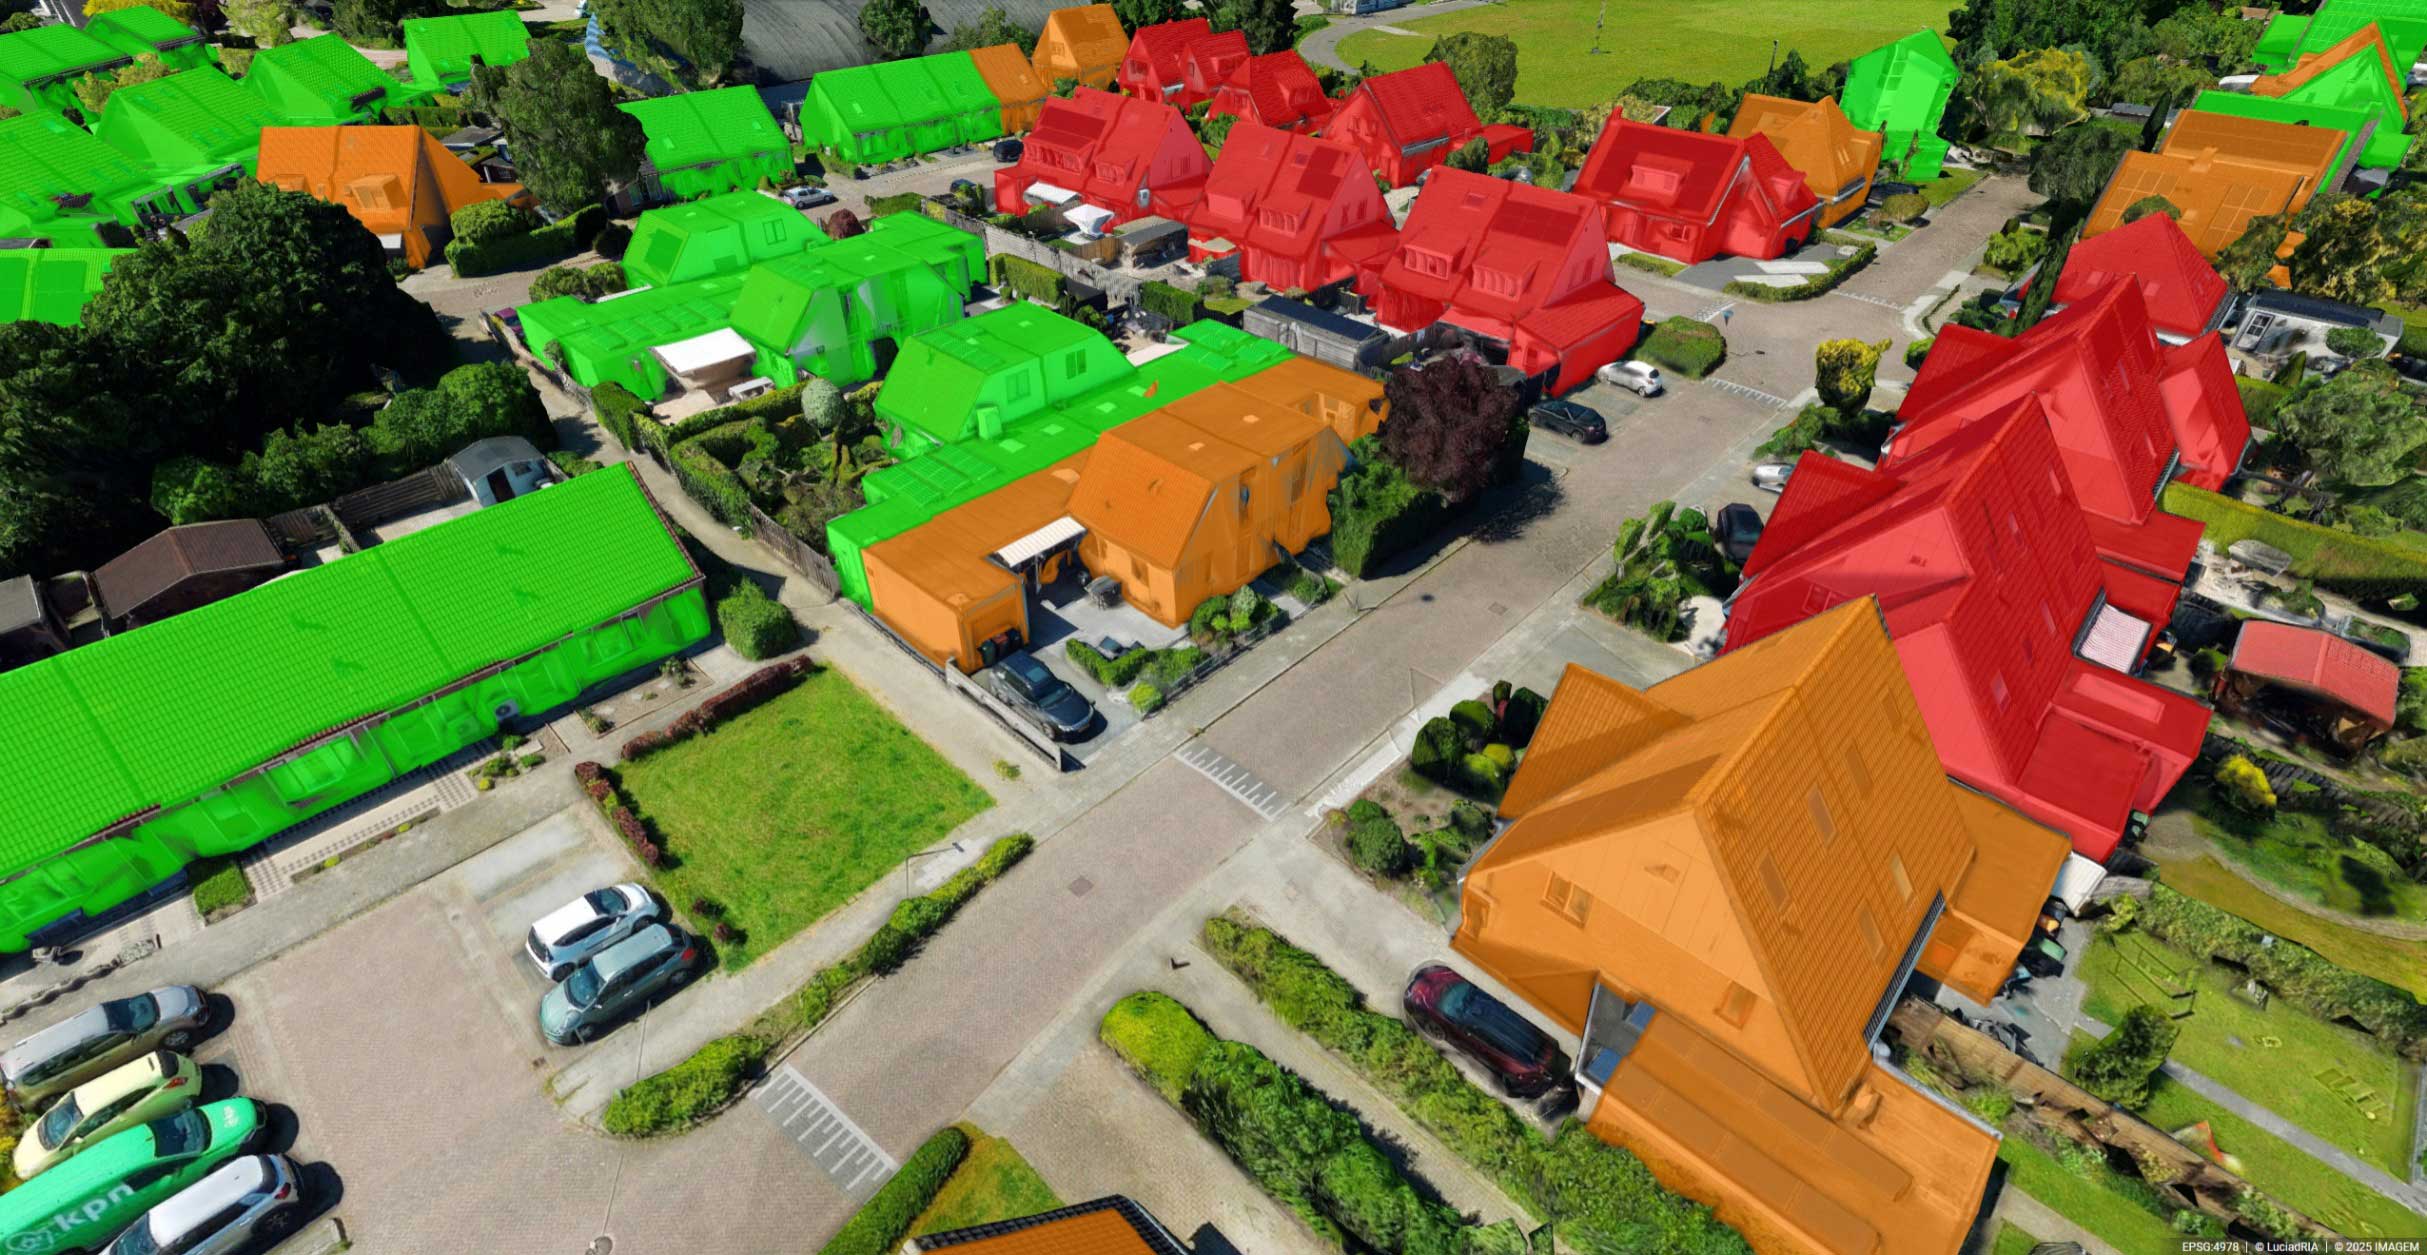
A view of greenery outside contributes to well-being, reduced stress, and a sense of connection with nature. But how do you determine whether residents can see three trees from their homes? Instead of complex “line-of-sight” calculations, we use a practical approach: we create buffers around each building and count the number of trees within that radius. This way, each property receives a score, ranging from excellent to insufficient, based on the distance to and the number of visible trees. Three trees within the smallest buffer? Then the status is excellent. The farther you have to look to see trees, the lower the status. This provides a reliable estimate without getting technically complicated.
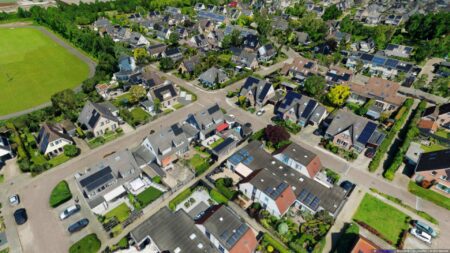
30% tree canopy cover in the neighborhood
The 30% canopy cover helps neighborhoods withstand heat stress and contributes to biodiversity. But what exactly is the right scale? Neighborhood level? District level? Or should you focus on the immediate surroundings of each building? Prof. Dr. Cecil Konijnendijk explains that the neighborhood level is key. We give you, as a municipality, the choice. Depending on your objectives and policy goals, you can choose the scale that works best for you. Our tools give you the flexibility to analyze and manage at different levels.
Within 300 meters of public green space
Access to green spaces is crucial for mental health, social interaction, and cooling. Every home should be within a maximum walking distance of 300 meters from a public green space. Is there a suitable park within that radius? Then the property scores positively. But when is something “green” enough? Here, too, there are questions of interpretation. When is something considered a park? Statistics Netherlands (CBS) defines a green space as at least 1 hectare. A bare grassy area technically counts, but provides little cooling and does not invite use. You can therefore set your own criteria: for example, only parks with trees, or by setting the minimum area yourself.
Why this approach works
If you’re working on greening and cooling initiatives in your municipality, you’ll want to know where you stand and what steps to take next. The 3+30+300 rule helps you:
- To map the current green infrastructure of existing neighborhoods
- More targeted design for new construction or renovation
- Putting climate adaptation measures into practice
- Distribute trees and green spaces more equitably across neighborhoods
- To improve the health and well-being of residents
- Contribute to nature restoration and biodiversity
Data analysis and visualization help inform decision-making and build support. Whether it’s a green space plan or a public engagement process, this approach allows you to engage people in a forward-looking vision for their living environment.
Staying informed: monitoring with data
Greening is not a one-time effort, but an ongoing process. That is why it is important to monitor the situation periodically: is the canopy cover actually changing? Have new buildings been constructed that obstruct the view of trees? By using satellite imagery, aerial photos, and open data, you can run new analyses every six months or annually. This allows you to stay on top of progress and adjust your policy in a timely manner.
Exploring scenarios with digital twins
What happens when you plant trees somewhere? How do cooling effects or visibility change when a new neighborhood is developed? Digital twins it possible to virtually simulate these kinds of scenarios. You place trees in a digital representation of your municipality and can immediately calculate whether the 3+30+300 goals are achievable. This allows you to translate policy and ambitions into concrete choices and visualize the consequences of spatial interventions before breaking ground.
Ready to try the 3+30+300 rule yourself?
IMAGEM municipalities with data-driven insights, smart visualizations, and practical models for greening initiatives. The 3+30+300 rule provides a solid starting point as well as the flexibility to adapt to your local situation. Would you like to know how to apply this in practice in your municipality?
Send Niels an email or send a message using the contact form.