
3D looks better. It makes plans tangible, understandable, and appealing. Almost everyone agrees on that. But as soon as the conversation turns to implementation, the same conclusion often follows: we don’t have 3D data. In this article, Reinier de Graaf shares his experience with 2D and 3D data. From presentations that spark enthusiasm to the reality of everyday practice. And above all, why that reality is changing rapidly and why the puzzle can increasingly be solved.
From Enthusiasm to the Reality of 3D Data
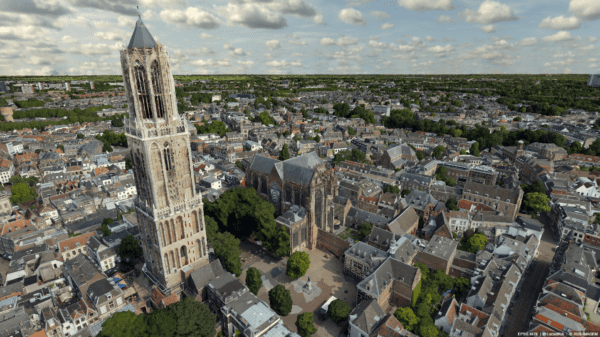
When I give a presentation or use Planspace Simulator, our digital twin, I try to get people excited about working with 3D data. I often do this by showing 2D and 3D side by side and asking questions about them.
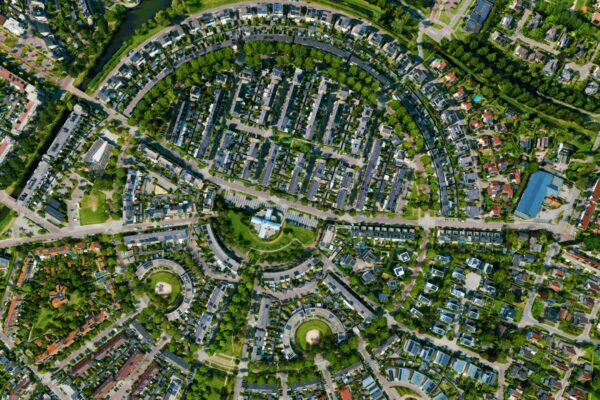
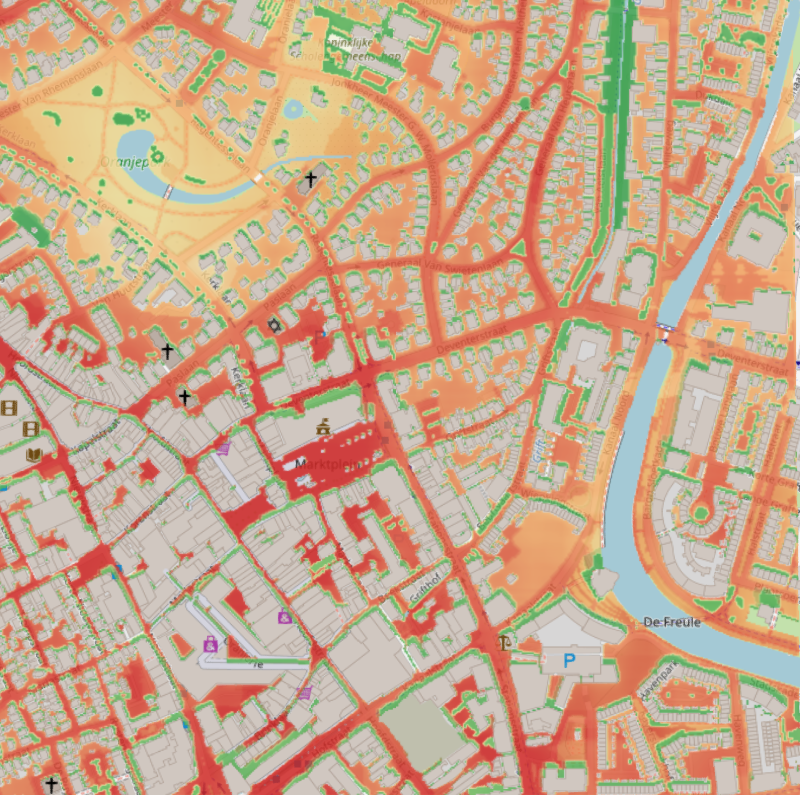
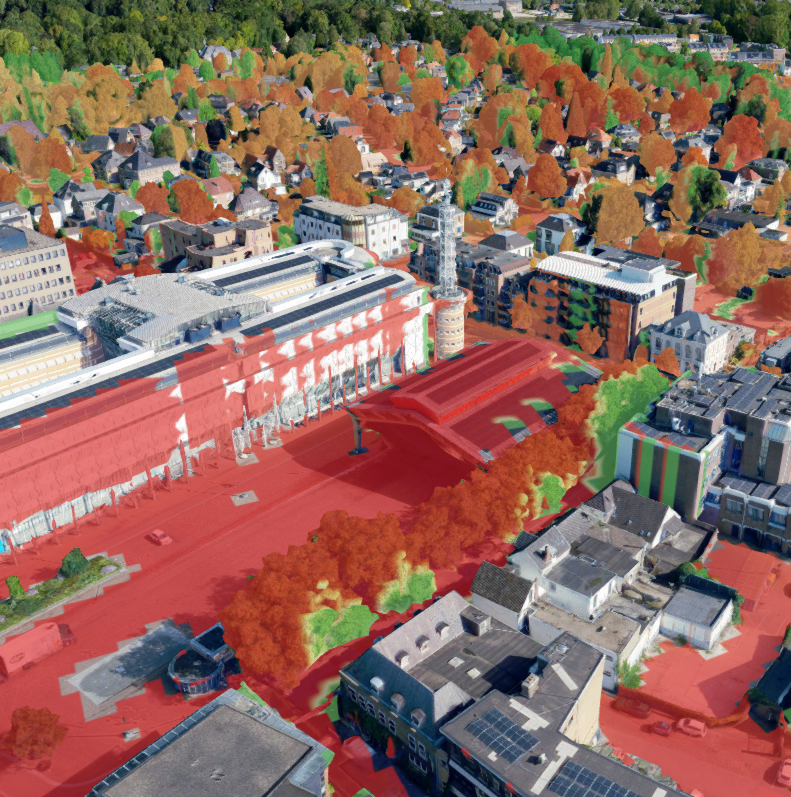
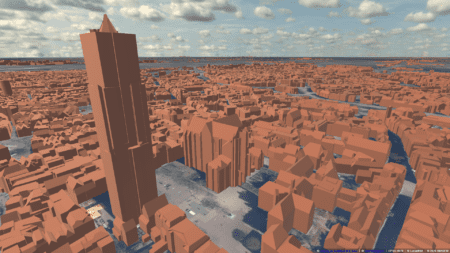
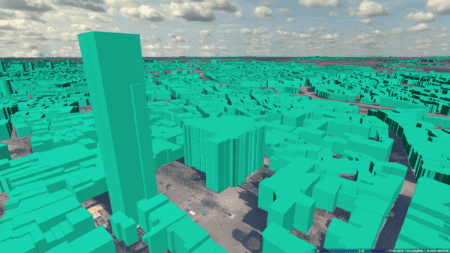
Below is the result of a heat stress analysis conducted by Tygron. As a user, what would you prefer to see? How can this information be most useful to residents when new plans are proposed for the neighborhood? And how can it help policymakers gain a better understanding of the situation?
The answers are predictable. 3D is just cool. Most people almost always agree on that. But more and more often, they’re also seeing the added value of 3D for creating the necessary information. It makes plans easier to understand and helps provide better insight into situations. Unfortunately, that enthusiasm fades quickly. Because after the presentation comes the reality. And that reality often sounds like, “Unfortunately, we don’t have any 3D data.” Well, that does make things difficult, of course.
The growing need for better and shared insights
That response really says it all. It’s not that 3D has no value, but that the necessary conditions for actually using it are lacking. At the same time, the need for better insight is growing. Issues surrounding urban development, the energy transition, and public participation are becoming more complex. Information is scattered across teams and systems, while what’s really needed is a single shared view. 3D helps create that view. Not as an end in itself, but as a way to make complexity transparent and accelerate discussions. The question thus shifts. It’s no longer whether 3D has value, but how you apply it in practice.
Available 3D data as the foundation for Digital Twins
That’s where things start to get interesting. Because that practice is changing. Fortunately, we’re seeing a trend where more 3D data is being made available. A great recent example is the 3D BAG data from TU Delft and 3DGI. Since September of last year, all BAG buildings in the Netherlands have been available as a 3D Tiles service, based on an open standard from the Open Geospatial Consortium (OGC). I’m a big fan of these kinds of standards. They ensure interoperability between different systems, and the data remains at the source. This has the desirable effect of ensuring there is a single owner of the data and that data can be exchanged more effectively.
At IMAGEM, we use this data directly in Planspace Simulator. We add the 3D BAG to the digital twin , immediately establishing a nationwide 3D foundation. The data is available at various levels of detail: LoD 1.2, 1.3, and 2.2. This may not mean much to you right away, but LoD refers to the level of detail in the 3D object. To clarify this, here is an example of the many LoD levels defined for 3D building models.
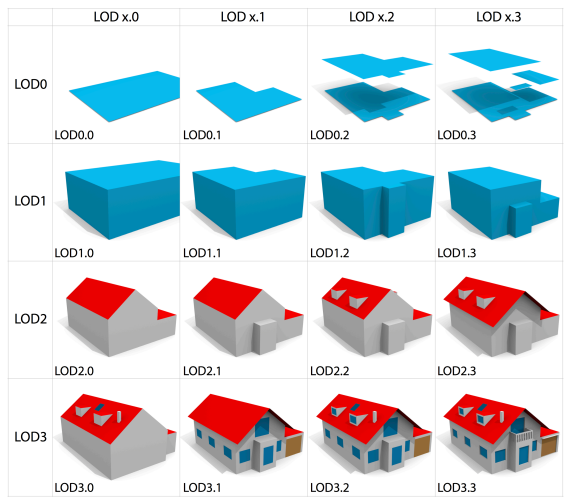
LoD 1.2 and 1.3 still look quite boxy, without a true roof shape. LoD 2.2, on the other hand, already has a fairly detailed roof shape and even shows dormer windows, for example. And that is often more than enough. Not every situation requires maximum detail, as in LoD 3.3. It’s about having the right information at the right time.
From scattered puzzle pieces to a single, functioning whole
Back to the real world. A 3D model is now available and ready for use for every BAG building in the Netherlands. I see this availability as yet another piece of the puzzle we’re putting together here in the Netherlands.
The beauty of this is that everyone creates their own puzzle using the pieces available. For some, this is a 24-piece puzzle; for others, it’s 500 (though then it’s more of a hobby that’s gotten out of hand). So every puzzle is different, and every puzzle has its own purpose in the Netherlands. Think of the puzzles surrounding (urban) area development, the energy transition, or improving citizen participation. But the ultimate goal is the same: to create new information, facilitate information exchange, and accelerate decision-making. And perhaps even more importantly, being able to share what you create. With colleagues, policymakers, residents, or anyone else. So that everyone is looking at the same thing and having the same conversation.
Actually, I hope that in the near future I won’t have to compare 2D and 3D in my presentations anymore. I hope that using 3D will have become standard practice and that everyone will have the pieces they need to put the puzzle together.
How IMAGEM helps put the pieces together
IMAGEM helps you transform disparate data into a cohesive and functional whole. With our expertise in geoinformation, open standards, and Digital Twin , we ensure that 3D data doesn’t just remain a visual tool, but actually contributes to insight and decision-making. We bring data together, make it understandable, and ensure that everyone works from the same information source. If you’d like to discover what your puzzle might look like and which pieces are already available, we’d be happy to show you how that works in practice.
More information
Reinier is the Product & Project Lead at IMAGEM. As Product Owner of Planspace Simulator heSimulator closely involved in translating customer needs and market developments into a user-friendly digital twin that anyone can use. With his full commitment and knowledge of digital twins , he digital twins to digital twins the living environment of tomorrow. Want to learn more? Send Reinier an email or send a message via our contact form.

Reinier de Graaf
Product & Project Lead