
Flooding can have major consequences for both urban and rural areas. Using remote sensing and data science, we can accurately determine where flooding is likely to occur. An elevation map, such as a Digital Elevation Model (DEM), provides valuable insights into water flows and potential risk zones. In this blog, I’ll show you how to use this data to find the best locations for water-retention solutions, such as green roofs.
Looking Back: Understanding Flooding Using Geospatial Data
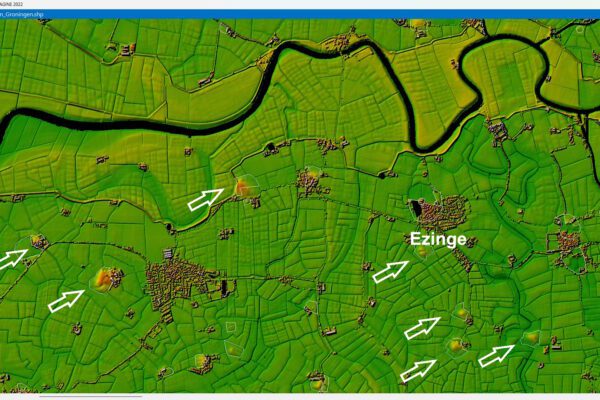
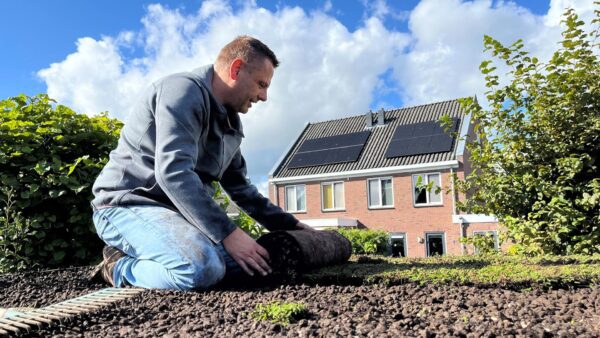
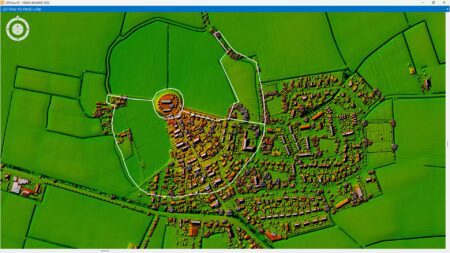
In the first part of this series on Ezinge, I demonstrated how you can use an elevation map—also known as a Digital Elevation Model (DEM)—to predict where flooding will occur after a downpour. This allows you to analyze where water accumulates and where retention areas may be needed. In addition to large-scale measures, there are also small-scale solutions, such as rain barrels or green roofs, that can help reduce flooding locally. I recently installed a green roof myself, and that seemed like a great opportunity to show you how to use elevation data to determine the most suitable locations for green roofs.
Determining the best location for a green roof
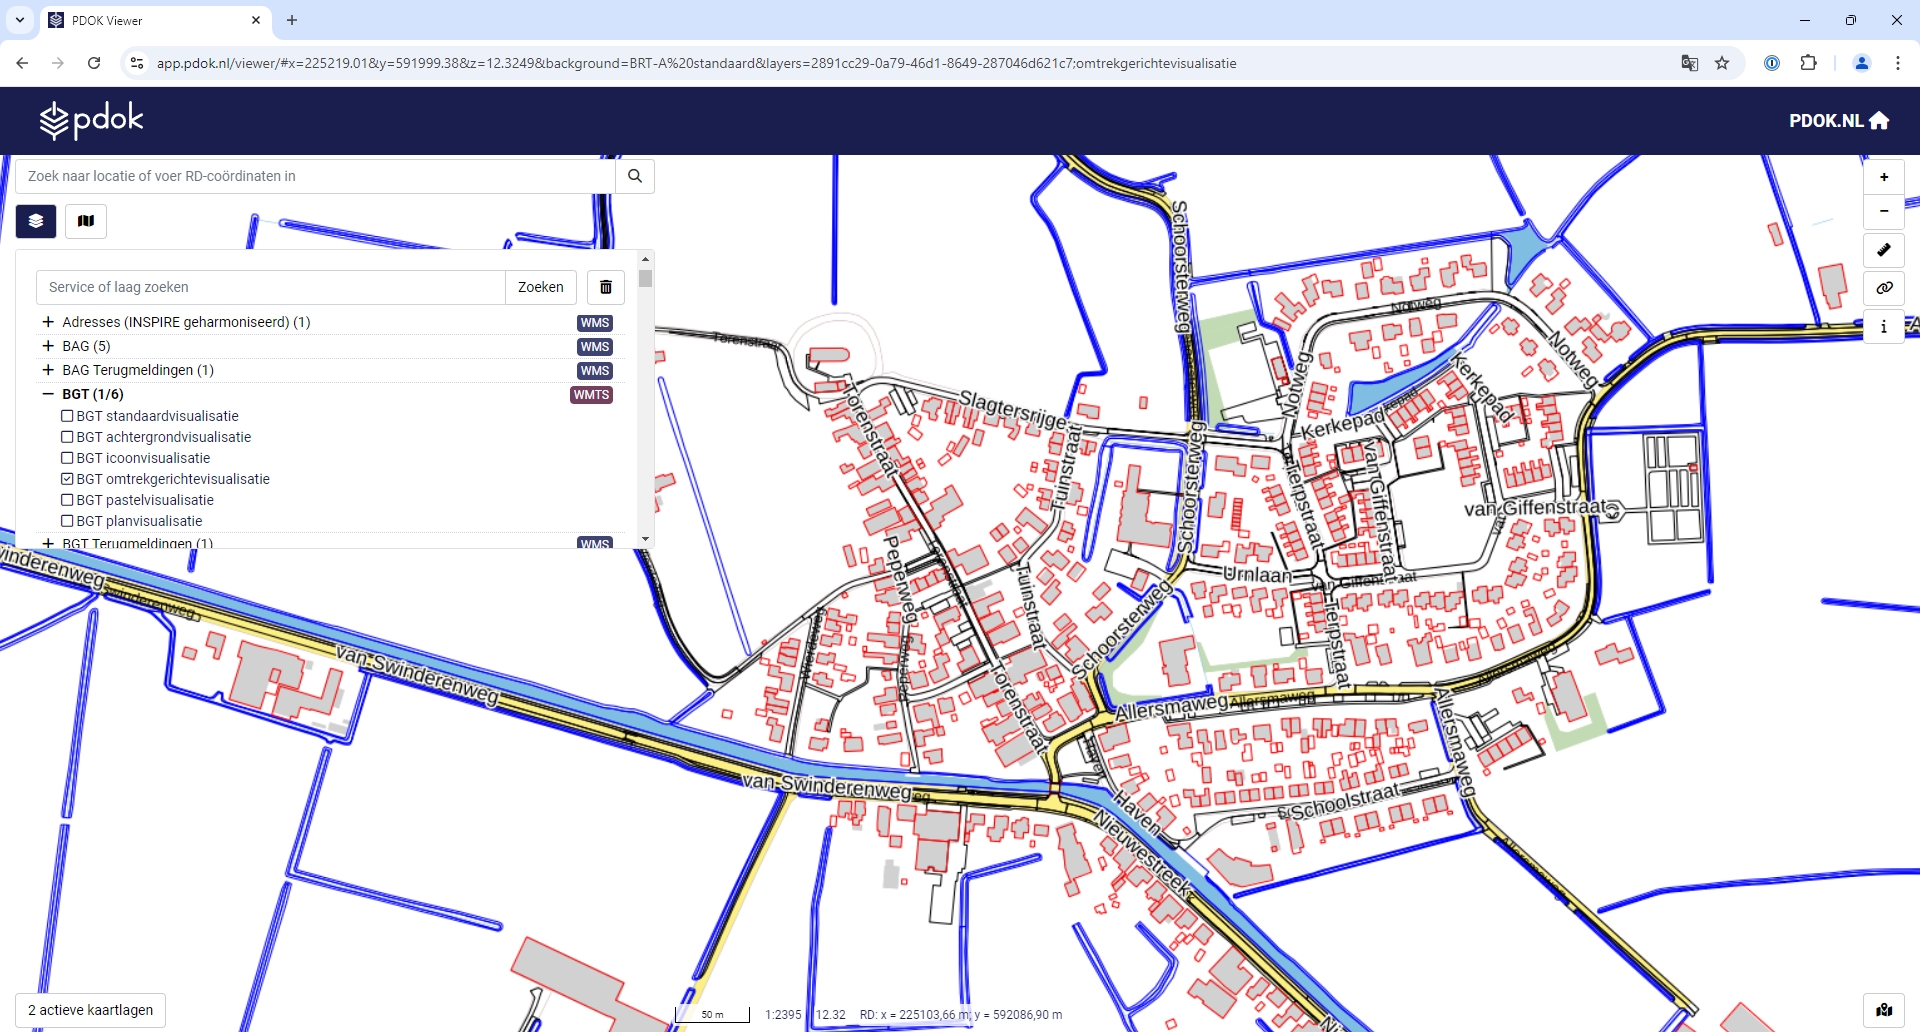
Elevation data can digital twin displayed in digital twin 3D digital twin , which is not only visually clearer but also provides greater insight into the surroundings because you can see the shapes of houses and roofs. We are again using the village of Ezinge in Groningen as a case study. To determine where a green roof would be most effective, we combine the elevation and flood data from the previous blog with the Digital Surface Model (DSM) and the buildings from the Large-Scale Topography Register (BGT).
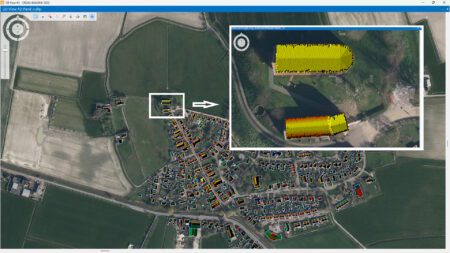
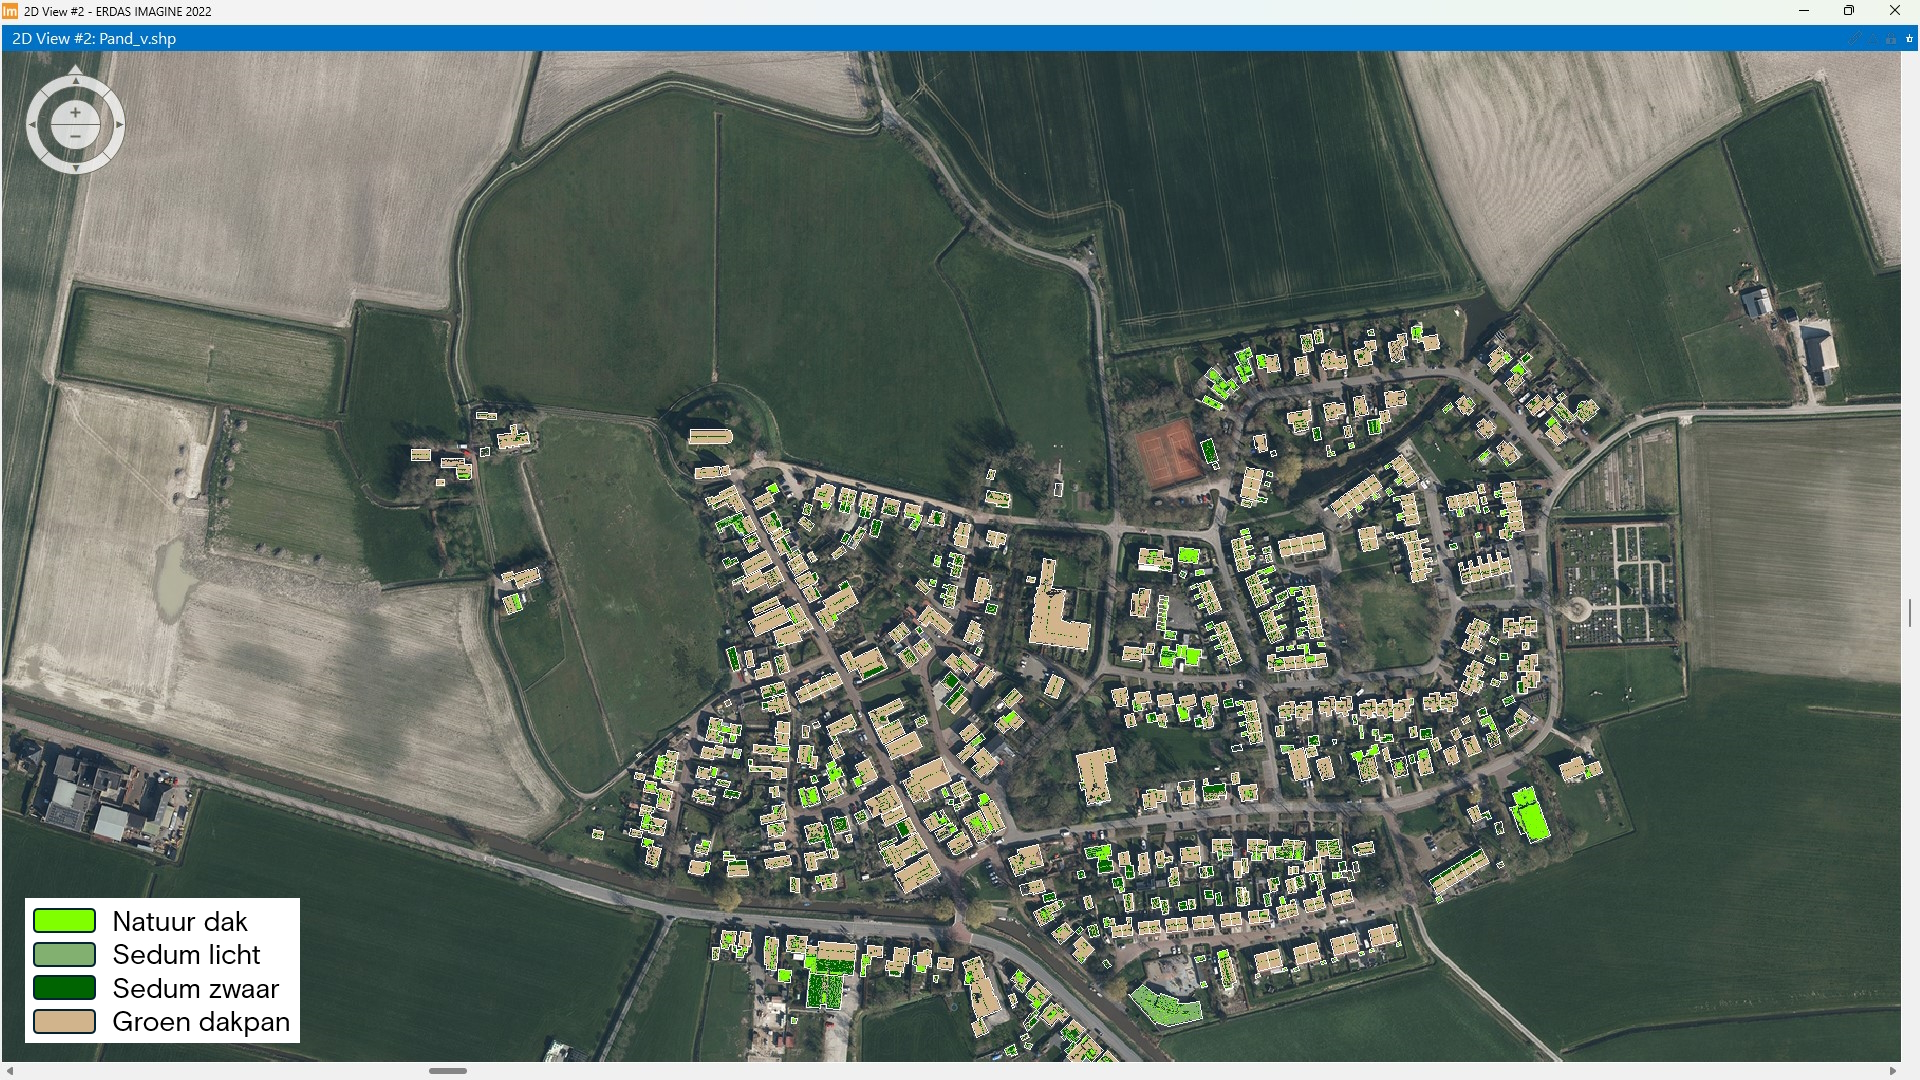
On the DSM map, we can see the outlines of buildings from the BGT. I use these outlines to select the buildings from the DSM. I then overlaid the selected buildings onto an aerial photo of Ezinge. I did not adjust the colors of the DSM.
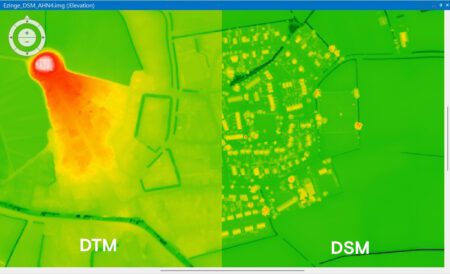
Digital Surface Model vs. Digital Terrain Model
A Digital Terrain Model (DTM) shows ground level—that is, the ground without vegetation or buildings. A Digital Surface Model (DSM) shows elevation, including all objects on the Earth's surface, such as trees and buildings.
Calculate suitability for green roofs
Now I can start doing the math. Math? Using the buildings from the DSM? Absolutely—using the buildings from the DSM, we can calculate the area and shape (such as roof angles) of each roof. By applying data science, we combine elevation data with the location of the buildings, and smart algorithms calculate whether a roof is suitable and which roof is best suited for a green roof. We then use these results to determine the investment and potential returns of different types of green roofs.
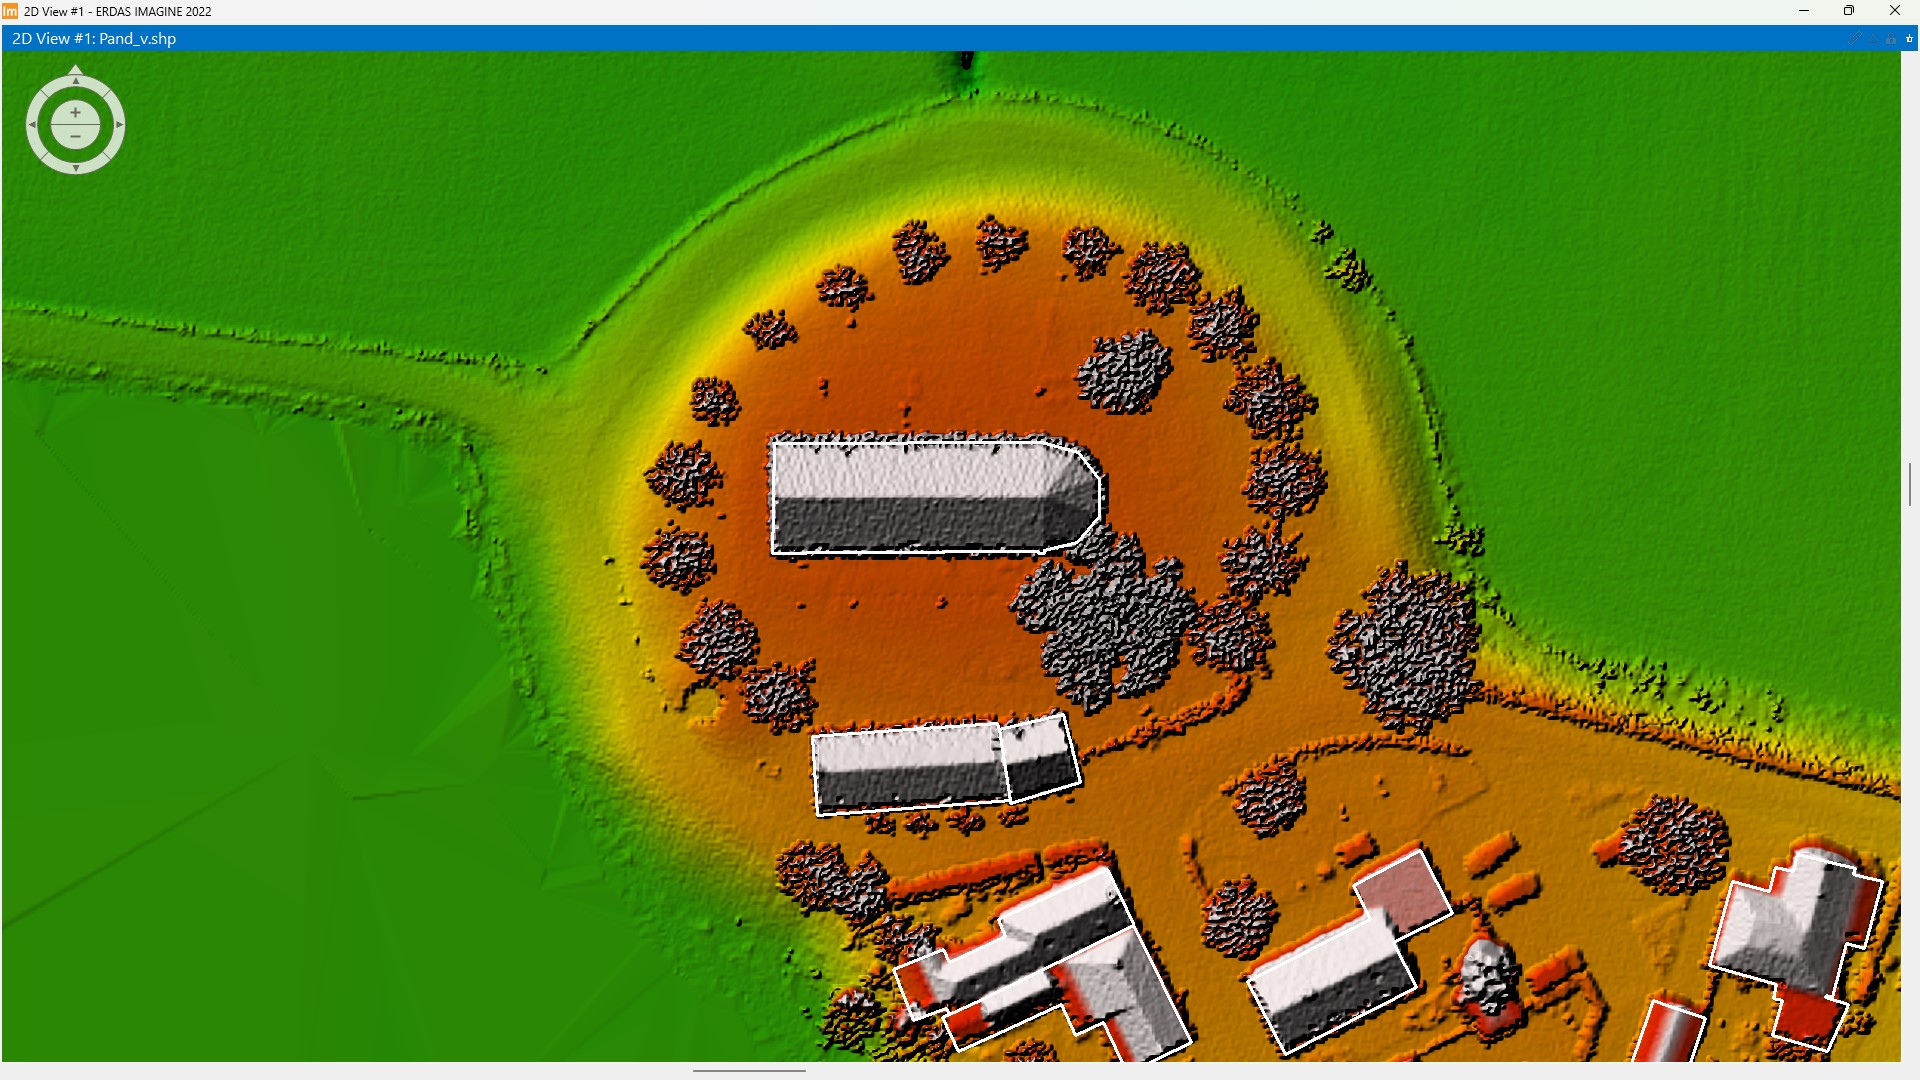
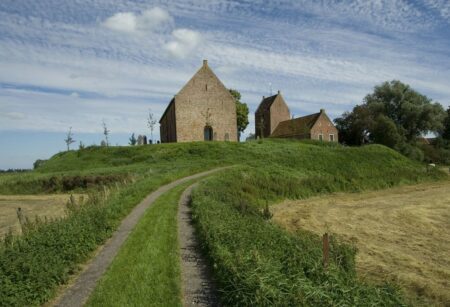
In the detail (Fig. 3), for example, we can see how the roofs and corners of the church in Ezinge are rendered in 3D.
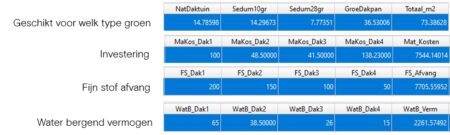
With this information, we can calculate the suitability of each roof for a green roof. In addition, we can also determine which type of roof works best. Options include a natural roof garden, a 10kg or 28kg sedum roof, or green roof tiles, for example. In our calculations, we take into account not only costs but also water retention capacity and particulate matter capture, as these values are known for each type of green roof. The calculations take into account:
– The average price per type in euros (€)
– The water retention capacity per type in liters per square meter (l/m²)
– The average particulate matter capture per type in grams per square meter (g/m²)
Basic Register of Large-Scale Topography (BGT)
The Large-Scale Topography Database (BGT) is a digital map of the Netherlands that clearly identifies buildings, roads, waterways, land parcels, and rail lines. The map is accurate to within 20 centimeters and contains many details, just as you would see them in reality. Think of trees, roads, and buildings. Just like the Current Elevation Database of the Netherlands (AHN), the BGT is free and available for unlimited use (open data) by governments, businesses, and citizens alike.
Optimal results and insights
The computer then calculates which types of green roofs are best suited to specific locations, including the associated investment and expected results. The output shows, for each building, which part of the roof is most suitable, based on the highest yield. This data is saved as a shapefile, a standard format for representing spatial vector data.
The results (Fig. 5) are shown by building. For clarity and ease of reference, I have listed the results for each component one below the other.
Kill four birds with one stone!
A green roof does more than just help manage water; it provides insulation (keeping buildings cool in the summer and warm in the winter), reduces particulate matter, and promotes biodiversity. Bees and butterflies, for example, benefit enormously from biodiverse roofs. So it’s not just about providing subsidies, but also about offering support in choosing the right type of green roof. With remote sensing data analysis, you gain more insight into the possibilities than you might expect. Or as Johan Cruijff once said: “You only see it once you understand it.”
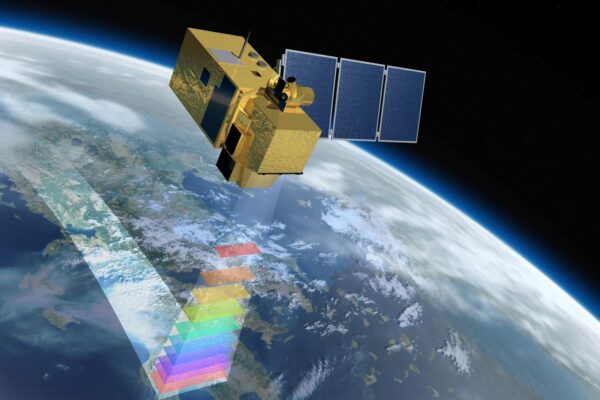
By working with local residents to install green roofs, you’re not only helping to build a more sustainable future by preventing flooding, but you’re also improving air quality and strengthening social cohesion in the neighborhood. In the next blog, we’ll continue to use elevation data and combine it with multispectral sensor information. I’ll explain what a multispectral sensor is, what information it provides, and how you can use it to monitor the health of green spaces (green roofs, trees, flower beds, and parks).
More information
Harald is a Business Consultant at IMAGEM. He bridges the gap between business, sales, and technology, and focuses on delivering value to the client. He collaborates with developers to create solutions for the public safety and security sector, educational institutions, and digital twins.
Would you like to learn more about this topic? Send Harald an email or send a message via our contact form.

Harald Görtz
Business Consultant
Ezinge, Groningen
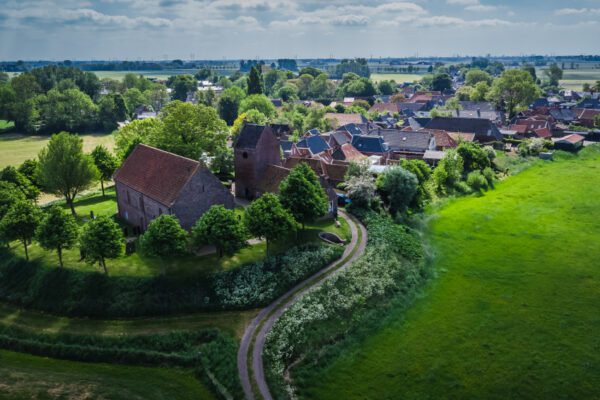
Ezinge is a small village in the province of Groningen, located in the municipality of Westerkwartier, and it has a particularly rich history dating back to prehistoric times. What makes Ezinge especially interesting is that it is one of the oldest continuously inhabited places in the Netherlands. Although Ezinge is now a small and quiet village with only a few hundred residents, it still attracts visitors interested in archaeology and history. It is a place where the past literally lies beneath your feet, and it offers a fascinating glimpse into the history of the Netherlands, particularly into how people adapted to and lived in a changing landscape.
Shapefiles
Shapefiles are one of the most common data storage formats for spatial data. They store data as points, lines, or polygons. These three feature types form the basis of spatial data analysis. In addition to spatial data, shapefiles contain a wealth of associated information. Shapefiles are commonly used in desktop GIS applications.
Data science
Data science is a broad field that draws on techniques and concepts from the wide-ranging disciplines of mathematics, statistics, information science, and computer science. The subfields of machine learning, classification, cluster analysis, data mining, databases, and visualization are key supporting disciplines. These are particularly relevant to spatial analysis.