
Remote Sensing a wealth of data. But if you don’t know how to look, you won’t know what you’re seeing. And that’s crucial. If you don’t know who’s looking, from where, with what, and for what purpose, then you don’t know what you’re measuring either. Data without knowledge of its origin, resolution, or context is worthless—or worse: misleading. Yet dashboards and digital twins are all too often filled with digital twins .
In the fourth part of our blog series, we therefore take a step back. Before we visualize or analyze, we must first understand what we are actually looking at. Remote sensing with observation—knowing who is looking, why, and with what instrument. Only then can you combine data into information that is accurate, meaningful, and usable.
A person sees what they know; a sensor sees everything but understands nothing.
— Harald Gortz, Business Consultant at IMAGEM
Remote sensing with observation
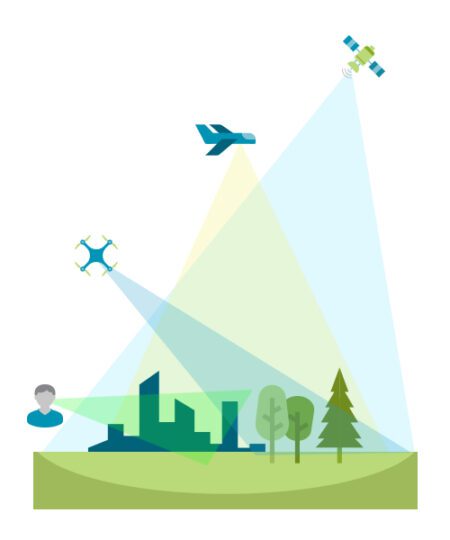
Remote sensing is the collection of information from a distance, without physical contact. This can be done using a sensor on a satellite, drone, or aircraft, but also with your own eyes. When you look out over a city from an observation tower, you are essentially engaging in remote sensing. However, your observation is limited to visible light and heavily dependent on experience, interpretation, and context.
Technical remote sensing further. Sensors detect near-infrared, thermal, radar, or laser pulses and provide objective, repeatable data—but without understanding what they are capturing. They see a lot, but understand nothing. That is why it is essential to know: which sensor are you using? From which platform? And for what purpose?
Four Ways of Looking
We're heading back to Ezinge, and we'll take a look at it in four different ways:
- Through human eyes: You walk through the village, notice the details, and soak up the atmosphere. But you lack an overall view.
- With a drone: You can view the landscape from above, identify patterns, see where greening is possible, and track changes on a day-to-day basis.
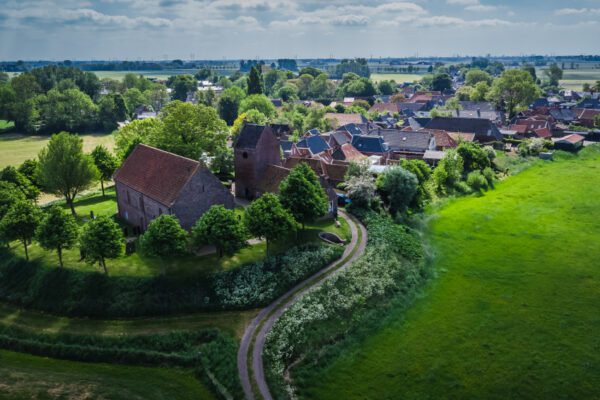
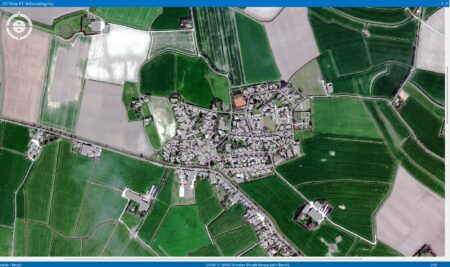
- By plane: You can see how the village fits into its surroundings. New neighborhoods, infrastructure, and green spaces become visible.
- Using a satellite image: You can see the timeline and scale. The village’s growth, in relation to other towns, natural areas, and climate trends.
Each perspective provides different data. Humans bring nuance, drones provide detail, aircraft offer an overview, and satellites provide context and time series. And they complement one another.
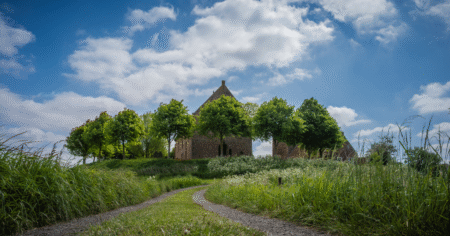
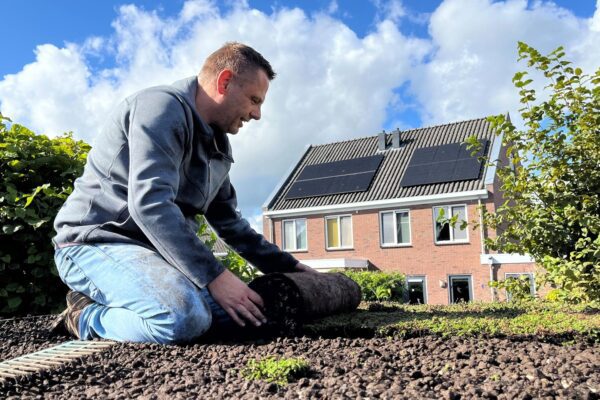
View from the ground
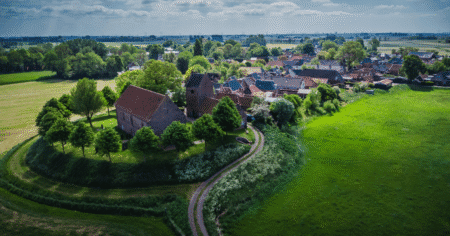
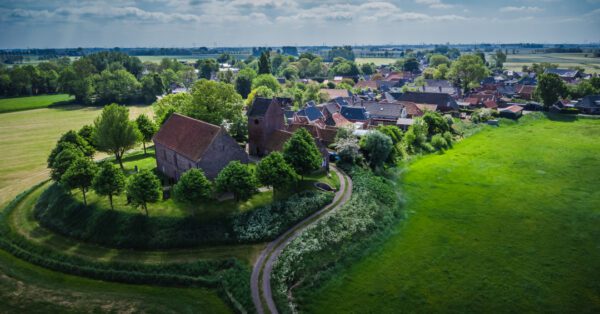
Aerial view captured by a drone
Aerial view from an airplane
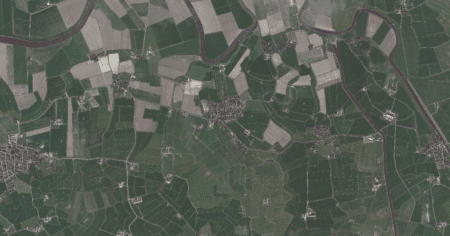
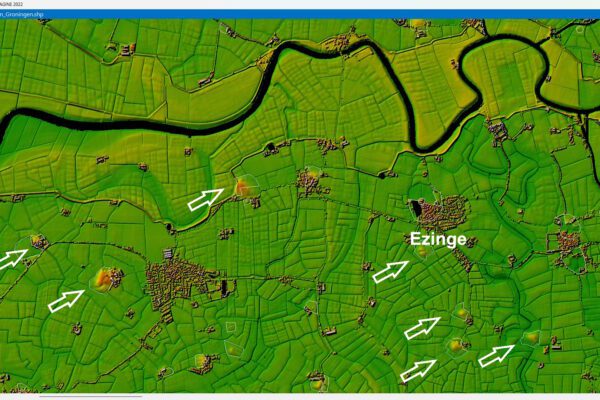
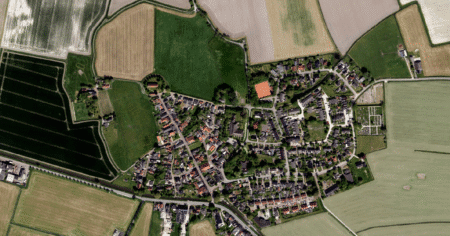
A view from space taken by a satellite.
From the ground to space: always a different perspective
When you walk toward Ezinge from the east, you look up from the ground at the church on the mound. You see bricks, grass, trees, and sky. Perhaps something catches your eye: weathered stones, flowers along the path. You take in the smells, sounds, and atmosphere, but your view is limited. You don’t see the landscape as a whole, let alone how it has changed over the past few years.
A drone flies overhead, dozens of meters up. It captures not only the church, but the entire village, the surrounding fields, and the roads. A single image reveals the relationship between people and the landscape. The drone can take repeated images to document changes week after week.
Aircraft fly even higher. From altitudes ranging from hundreds of meters to several kilometers, they take aerial photographs of entire municipalities or provinces. While drones operate locally, aircraft provide a regional overview. They can capture the growth of multiple villages or cities at once, and at this altitude, traffic flows, waterways, and built-up areas become visible in their entirety. Using multispectral, LIDAR, and thermal sensors, we can see where vegetation is disappearing, where heat stress is occurring, and how infrastructure is changing land use. This information helps inform sustainable decisions, such as creating shaded bike paths or preserving green buffers.
And then there are the satellites. They orbit at altitudes of hundreds of kilometers and provide a global perspective. Satellites operated by NASA, ESA, or commercial entities such as Planet capture images of the same locations on Earth on a daily or weekly basis. This creates time series of urban growth spanning years or decades. Satellite images show how cities are expanding into vulnerable natural areas and how, for example, coastlines are shifting due to development or climate change. Satellites use multispectral sensors, LIDAR, thermal cameras, and—though not covered in this blog series—radar as well.
Each "eye" sees something different; together, they form the image
One more time: a sensor sees a lot, but understands nothing. Only humans can give meaning. Every “view”—whether from a person, drone, airplane, or satellite—provides a different piece of the puzzle. By combining them intelligently, we create coherence.
I have summarized this in the table below.
| Feature |
|
|
|
|
|---|---|---|---|---|
| Range | Street level | A few square kilometers | Municipal or provincial level | Municipal or provincial level |
| Details | High (visual) | Very high (cm resolution) | High (sub-millimeter resolution) | High (30 cm–30 m resolution) |
| Spectral range | Visible light only | Infrared, thermal, LiDAR, multispectral | Infrared, thermal, LiDAR, multispectral | Infrared, thermal, LiDAR, multispectral |
Multispectral images
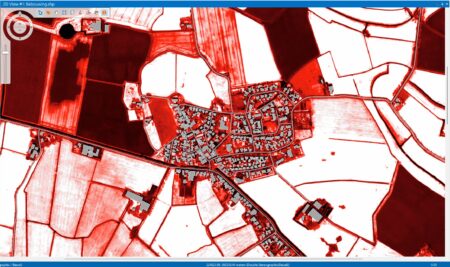
Take, for example, a multispectral satellite image of Ezinge with a resolution of 30 cm. You can see plots in different colors and patterns, with noticeable variations. Overlay a Normalized Difference Vegetation Index (NDVI, see Part Three) on top of that, and you can monitor vegetation: the redder the image, the lower the vegetation value. But even that image remains abstract.
NDVI (Detecting Greenery)
The NDVI, which I explained in a previous blog post, allows you to assess the condition of the vegetation. On the map of Ezinge, the NDVI is shown in shades of red: the redder the color, the lower the value.
We can’t draw any immediate conclusions based on that; the image shows many different shades. That’s why we’re using a remote sensing: RGBI.
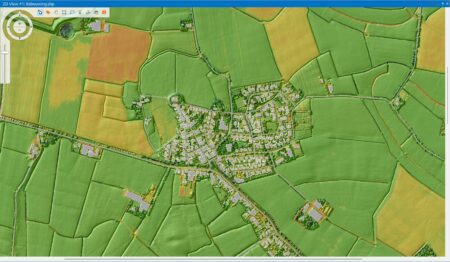
RGB stands for Red, Green, and Blue, the part of the light spectrum that we can see with the naked eye. The "I" stands for intensity, and for that we use the NDVI. The higher the NDVI value—meaning the more intense the vegetation—the better.
With RGBI, we highlight the structure and condition of the landscape.
We then overlay this combination onto the DTM (the Digital Terrain Model we discussed in Part 1 of this blog series).
Presenting the information
This is how context is created: differences in elevation explain why some fields vary. The satellite data (multispectral), the LIDAR data (elevation), and human interpretation together provide insight. Only through this combination does the data become meaningful.
Why this is so important before you build your dashboards
If you don’t know how and with what tools you’re analyzing the data, you won’t know what you’re measuring. And then you can’t digital twins reliable dashboards or digital twins . Data without insight into its source, resolution, or context leads to incorrect assumptions. Only when you understand who is analyzing the data, where it comes from, with what tools, and why, can you combine data in a way that makes it meaningful and reliable.
Looking Ahead: From Watching to Building
In part five of our remote sensing , we take the next step: we combine insights from different perspectives into a cohesive dashboard or a digital twin. But today was all about the foundation: looking closely. Because without that first step, there’s little of value to show.
More information
Harald is a Business Consultant at IMAGEM. He bridges the gap between business, sales, and technology, and focuses on delivering value to the client. He collaborates with developers to create solutions for the public safety and security sector, educational institutions, and digital twins.
Would you like to learn more about this topic? Send Harald an email or send a message via our contact form.

Harald Görtz
Business Consultant
LIDAR
LIDAR stands for Light Detection and Ranging. It is a technology used to measure distances using lasers. By measuring the time it takes for light to hit an object and bounce back, LIDAR can create a highly accurate image of the surroundings.
LIDAR uses lasers to create precise 3D maps of the surrounding area, for example in geography, drone technology, and archaeology. It offers high accuracy, works in the dark, and can measure through vegetation.
The drawbacks include high costs, reduced effectiveness in fog or rain, and the need for a direct line of sight. As a result, it is powerful but not always suitable for every type of environment.
MULTISPECTRAL
Multispectral remote sensing is a technique in which images of the Earth are captured across multiple wavelengths of light—such as visible light, near-infrared, and sometimes thermal—to gather information that is invisible to the human eye. Sensors on satellites or drones therefore take images in multiple “colors” or spectral bands.
Multispectral remote sensing sensors to capture images across multiple wavelengths of light, thereby revealing information that is invisible to the human eye. It is used in agriculture, environmental research, urban planning, and nature conservation. The technology enables large-scale monitoring and can detect changes at an early stage.
The disadvantages include lower resolution, the impact of weather conditions, and the need for expert interpretation.
THERMAL SENSORS
A thermal sensor measures the thermal radiation (infrared radiation) emitted by objects on Earth, rather than reflected light. This allows temperature differences on the Earth's surface or in objects to be detected, even in complete darkness.
Thermal sensors measure heat radiation from objects and provide insight into temperature differences, even in the dark. They are used for fire detection, agriculture, urban heat island analysis, and water management. Their advantages include nighttime operation and the ability to identify heat-related issues.
The drawbacks include lower resolution and atmospheric interference, which makes interpretation more difficult.