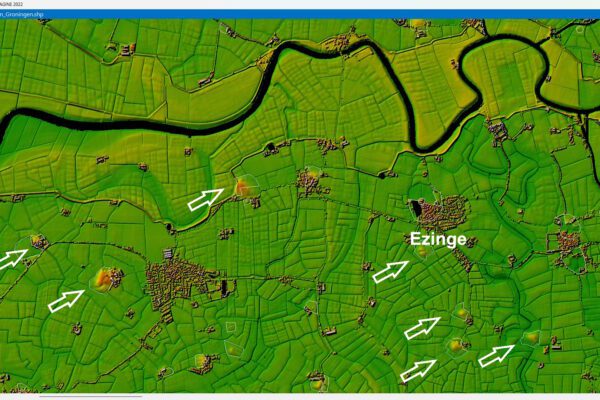

In part two of our blog series on Ezinge, I showed you how to use an elevation map, such as a Digital Elevation Model (DEM), to identify ideal locations for water retention solutions like green roofs. In this blog, I’ll take it a step further: with remote sensing satellite data, you can not only monitor existing green roofs but also discover new, suitable locations—without having to climb onto the roof yourself.
Green roofs help mitigate flooding caused by heavy rainfall. Does your municipality want to be prepared for the future? Discover how you can easily use satellite data to identify the most effective locations for green roofs and make your city more climate-resilient!
How NDVI Helps Identify Green Roofs
An effective way to detect green roofs is the Normalized Difference Vegetation Index (NDVI). This index shows where vegetation is present and how healthy it is. Although the technique was invented as early as 1972, high-resolution satellite images have only become freely available in recent years through the Netherlands Space Office’s satellite data portal. Moreover, the technology is now more accessible thanks to improved computers and software capable of handling large remote sensing.

What is a multispectral image, and why do we use it?
To calculate the NDVI, we use red and infrared light values from a multispectral image. A multispectral image consists of multiple color bands, and it also includes “light” that is invisible to the human eye, such as infrared, in the imagery. All colors are stored in a separate layer within the image, and in remote sensing , we refer to each layer remote sensing band. These bands can be used by software to distinguish between objects on the Earth’s surface.
Vegetation absorbs red light to grow, and the healthier the vegetation, the more red light it absorbs. Infrared light, on the other hand, is reflected back by healthy plants. By visualizing these layers as separate colors, we can easily identify the areas where healthy vegetation is growing.

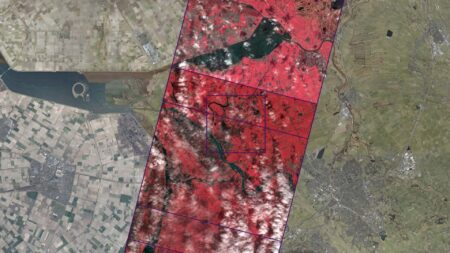
Figure 2 shows what the landscape of Ezinge normally looks like (in RGB) and what it looks like in infrared (where vegetation appears bright red).
For example, you can see red roof tiles on the roofs. You can also see various shades of green. The meadows and trees are green. Some trees are greener than others. This difference isn’t just due to the tree species; it also indicates whether a tree is healthy. This type of color image helps us see how well plants are growing and how densely vegetated an area is. And we use these red and infrared values to calculate the index.
Getting started: How does the classification of green roofs work?
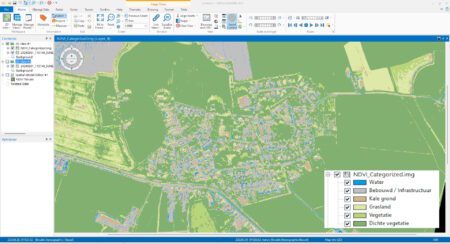
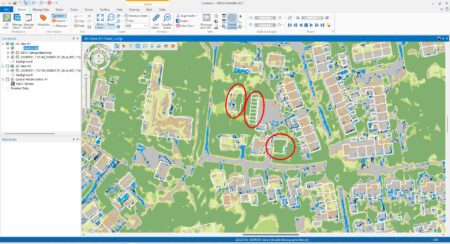
Using satellite images of Ezinge (Figure 3), downloaded from the Netherlands Space Office, we calculate the NDVI and classify the landscape based on vegetation, built-up areas, grassland, and more. By combining this data with building records from the Large-Scale Topography Database (BGT), we can identify which buildings are likely to have green roofs (Figure 4).
Are all those roofs really green?
Not every roof with vegetation is automatically a green roof; for example, trees and shrubs can grow over roofs and thus appear to form a “green roof.” To distinguish between them, we use AI. By instructing the computer to look for rectangular shapes (since trees are rarely angular), we can more accurately identify the actual green roofs. This provides a more precise picture of where green roofs are located.
A trip to the Ondiep neighborhood in Utrecht
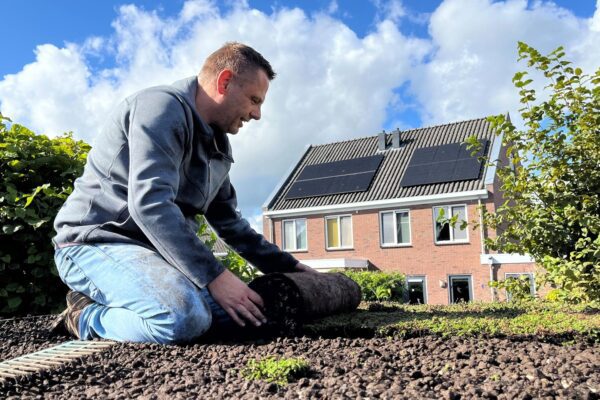
There aren’t many green roofs in Ezinge yet. So, for the sake of privacy and to explain things more clearly, I’m taking a trip to Utrecht. There, the city of Utrecht has been encouraging the installation of green roofs through subsidies in recent years, and more green roofs have been built.
For this example, I’ll focus on the Ondiep neighborhood in Utrecht. Not only for the sake of clarity, but also because this neighborhood has frequently made the news in recent years due to residents’ initiatives to install green roofs. Residents here have taken the initiative themselves to make their neighborhood greener. I find that remarkable, because green roofs are not only good for water retention and ecological enhancement, but also contribute to social cohesion.
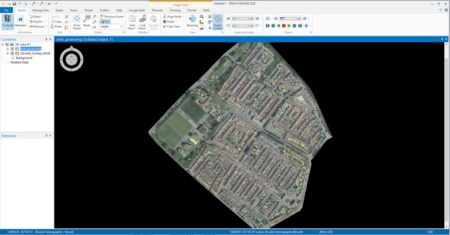
In Figure 5, I performed the same calculation using data from the Ondiep neighborhood as I did with data from Ezinge. According to the computer, quite a few green roofs have been installed in this neighborhood.
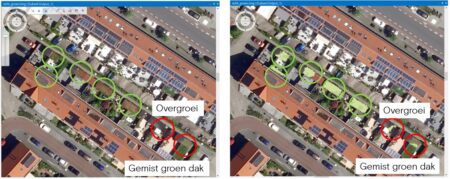
But not everything that is green within the boundaries of a building is actually a green roof. We can see this when we zoom in on Figure 6.
We see trees and shrubs growing over rooftops… and green roofs that the computer hasn’t detected. To find them anyway, we incorporate a bit of AI into the NDVI calculation. We tell the computer to look at the shape and structure. The likelihood that a tree or shrub is square and angular is negligible. We also tell the computer that if the vegetation isn’t entirely healthy, this should be taken into account as well.
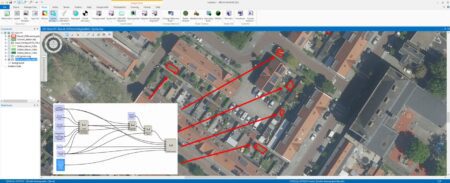
So we tell the computer to look for rectangular shapes and structures. This produces the result shown in Figure 7.
The computer now clearly shows where the green roofs are located. We can also see that some green roofs are not in very good condition. This is simply done by comparing their shape to the shape of the roof.
Monitoring the health of green roofs
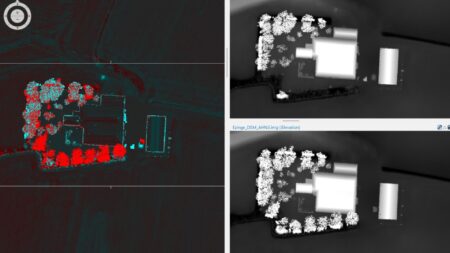
Monitoring the health of green roofs is essential for long-term success. To do this, we compare NDVI and elevation data from different time points. By analyzing changes in elevation and structure, the computer can identify where vegetation has grown or become less healthy. Figure 8 shows the results.
Wherever the computer detects growth, it highlights it in red. Why red and not green? To answer that, we need to go back to the beginning of this story. There, I used the infrared band to observe the vegetation. The redder, the better. This information helps policymakers respond quickly to changes.
What can you do with these insights?
Satellite data, combined with open data, computational models, and AI, provides insights that cannot be obtained as efficiently by any other means. This enables you to make data-driven decisions and visualize complex issues. In part four of this series, we’ll explore how you can present this information in dashboards and digital twins better inform stakeholders.
More information
Harald is a Business Consultant at IMAGEM. He bridges the gap between business, sales, and technology, and focuses on delivering value to the client. He collaborates with developers to create solutions for the public safety and security sector, educational institutions, and digital twins.
Would you like to learn more about this topic? Send Harald an email or send a message via our contact form.

Harald Görtz
Business Consultant
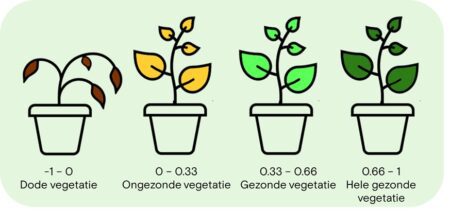
NDVI
The Normalized Difference Vegetation Index (NDVI) is an index used to measure the amount of greenery. You can determine how healthy a plant is using the NDVI, the Normalized Difference Vegetation Index. The NDVI uses infrared and red light in its formula. Unfortunately, we cannot see infrared light with our eyes, let alone use it in calculations. A sensor (camera) can, however, and a computer can process it.
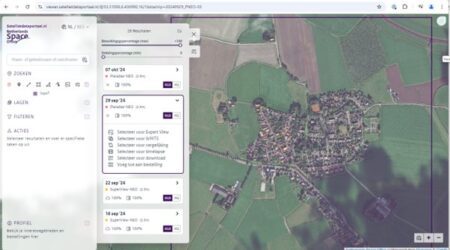
Satellite Data Portal
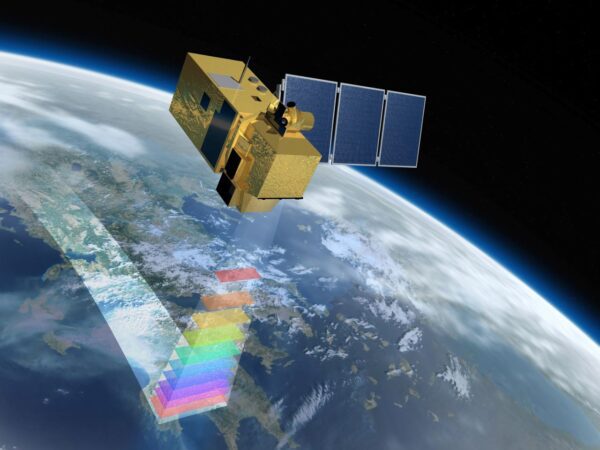
Through the Satellite Data Portal, the Netherlands Space Office (NSO) provides companies, individuals, and organizations in the Netherlands with free access to high-resolution satellite imagery. The Satellite Data Portal consists of several features. For example, the Satellite Data Portal provides (free) access to pre-processed satellite data of the Netherlands: a generic service that allows (high-resolution optical) satellite images to be easily searched and viewed in an online viewer. In addition, the data is available as web services for use in your own GIS application.
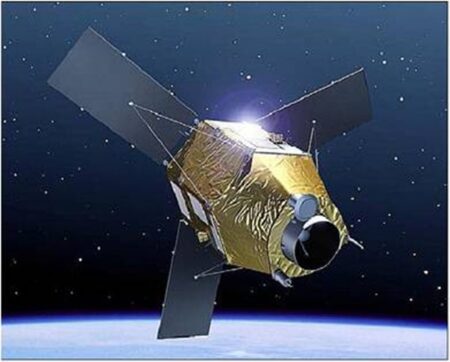
Pleiades Neo
Pléiades Neo is a very high-resolution optical constellation consisting of two identical satellites positioned 180° apart. Pléiades Neo 3, the first satellite in the constellation, was launched on April 28, 2021, followed by Pléiades Neo 4 on August 16, 2021.
Remote Sensing Training
Want to know how you Remote Sensing apply Remote Sensing in your daily work? During our three-day training course, you’ll dive into the world of satellite imagery, drones, machine learning, and smart analytics. You’ll learn how to collect, process, and apply remote sensing for practical applications within your organization. From combining datasets to visualizing insights, by the end of this training you’ll know how to use remote sensing to improve decision-making.
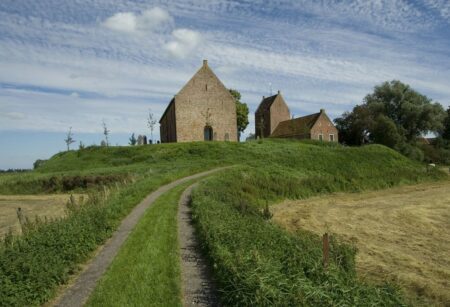
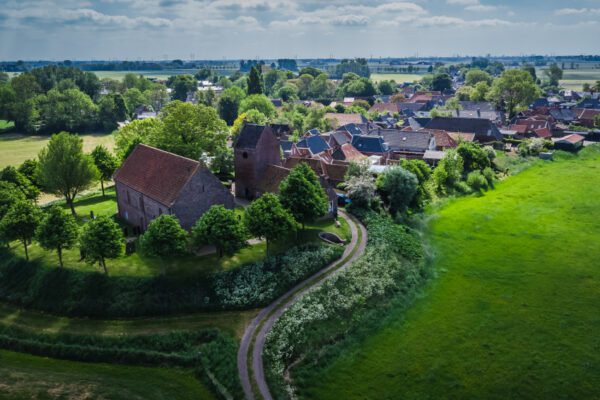
Ezinge, Groningen
Ezinge is a small village in the province of Groningen, located in the municipality of Westerkwartier, and it has a particularly rich history dating back to prehistoric times. What makes Ezinge especially interesting is that it is one of the oldest continuously inhabited places in the Netherlands. Although Ezinge is now a small and quiet village with only a few hundred residents, it still attracts visitors interested in archaeology and history. It is a place where the past literally lies beneath your feet, and it offers a fascinating glimpse into the history of the Netherlands, particularly into how people adapted to and lived in a changing landscape.