
“Working with geodata isn’t just my job—it’s almost a passion,” Tom Lonnee shared in a post on LinkedIn. Working for the city of Almere, he contributes daily to projects and products that enhance the quality of life and living in the city. In 2021, this began with a project for the Almere Haven district. Tom was tasked with providing a clear overview of the housing stock in this district.
Tom has been working at the municipality for over two years as an all-around GIS specialist on the Geo-data team within the City Operations department. He ensures that the municipality’s databases remain up to date and that the data managed by the team is accessible to other colleagues within the organization. He does this, in part, using the Smart M.Apps from the M.App Enterprise solution. These are interactive dashboards that clearly display various types of data at a glance. Recently, he set up a dashboard that displays the housing stock of Almere Haven.

Working with geodata isn't just my job—it's almost a passion
— Tom Lonnee, All-around GIS Specialist at the City of Almere
“The assignment came from a project initiated by the Port Alliance—comprising the municipality, businesses, housing authorities, and community organizations—which aims to improve the port area across eleven key areas,” Tom explains. One of those themes is the housing stock. Municipal policymakers wanted to know whether more or less development is needed for housing, and housing authorities want to know whether they need to adjust their strategy. An insightful dashboard can help with this.
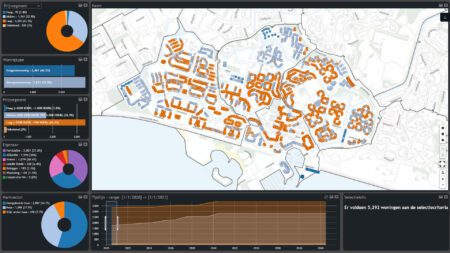
Tom explains this enthusiastically: “The dashboard displays all housing units and their associated attributes within the district. These include price segments, owners, and market sectors, such as private and public rental housing or owner-occupied homes. You can also view these attributes over time. What did the balance between rental and owner-occupied housing look like in the past, and what does the future hold with the planned housing developments?”
Trial and error
According to Tom, setting up the dashboard was a classic case of trial and error. This was partly due to the sheer volume of data that was available and scattered across various sources. “The biggest challenge was getting all this data together. The data existed, but it was spread across various types of sources and distributed across different departments both within and outside our organization. In addition, this data also had to be linked to a location to make it visible on the map.”
That’s why we started with a small portion of the area. We added a few parameters and expanded it step by step. Tom: “We were soon able to incorporate almost the entire dataset. The question then was whether adding all the data would make it clear enough. Is that really what we want?” The information that is ultimately displayed does help the parties involved. “It’s a kind of assessment mechanism. This data is used to assess whether the objectives of the established vision are being met, or whether the strategy needs to be adjusted—such as building more new homes. This is incorporated into the data, and this data can then be reloaded into the Smart M.App.”
The whole city
The Geo-data team is very impressed with the technology: “We’re really pushing the technology to its limits, because we’re dealing with an enormous amount of data that’s all stored in one place. We’re closely monitoring whether the dashboard continues to perform well with these large volumes of data. If not, we’ll make adjustments to the dashboard. Fortunately, it’s very easy to add widgets to the dashboard. That helps make the data more transparent.”
Tom Lonnee and his colleagues are excited to continue this project in 2022. “We launched the first version in October, and we’re currently evaluating it. We’re going to update the data and fine-tune it further to meet our needs. We also want to automate more processes. Our goal is to expand this project to cover the entire city. How cool would that be?!”
With M.App Enterprise, Almere’s Geo-data team enables the municipality to manage operations dynamically. Geo-information is clearly displayed in dashboards that are easy to customize. Want to get started with M.App Enterprise? Click the button to explore all the available options. We’re happy to help!
More information
Niels is the Government Market Manager at IMAGEM. He helps government agencies continuously work smarter and more effectively, and fulfills his role by supporting organizations in solving their challenges. Want to learn more? Send Niels an email or send a message via our contact form.

Niels van de Graaf
Government Market Manager