By 2050, new and existing homes in the Netherlands will no longer be allowed to use natural gas for cooking and heating. For municipalities, this means they must start making choices about alternative heat sources now. By digital twin heating and cooling alternatives in a digital twin , it becomes clear as early as the planning phase which solutions are feasible and affordable for each neighborhood. The result: greater insight, faster decision-making, and a solid foundation for a natural gas-free future.
The goal is to transform the current WAT map into a comprehensive 3D information resource for future heating and cooling systems.
— City of Rotterdam
3D helps municipalities choose alternative heat sources
The Netherlands is transitioning to a natural gas-free future. For municipalities, this means that by 2050, homes and buildings in the city will no longer be allowed to use natural gas for cooking and heating. It is a complex challenge: alternative heat sources must be selected that are affordable, technically feasible, and compatible with the existing environment and the electricity grid.
Questions facing municipalities include: What is affordable? What is technically feasible? And how does the solution fit into the existing environment and the energy system?
To address this issue, the City of Rotterdam developed the WAT map (Heat Program with Alternatives to Natural Gas). This map shows which alternative to natural gas is best suited for each area. While the WAT map was initially available in 2D, we are now converting it into a 3D version that can be visualized in a digital twin. This provides municipalities with a powerful tool to better understand and analyze heating and cooling systems and make decisions together with partners.
Get started with your own data in 3D and work with IMAGEM to gain insight into IMAGEM heat transition.
By combining these principles, you can quickly gain insight into the current situation and identify opportunities and challenges. We’ll explain each one in detail below.
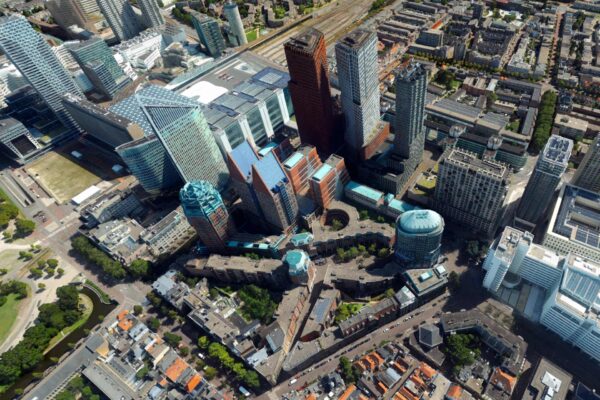
The power of the 3D WAT Map in the City of Rotterdam
Rotterdam is working hard to build a sustainable future. The City of Rotterdam is on its way to becoming a city without natural gas, where households cook and heat their homes using sustainable heat sources. Currently, approximately 250,000 homes in Rotterdam are connected to the gas grid.
Which heating solution is the best alternative to natural gas? What is an affordable alternative? What is the impact on the built environment and on above- and below-ground space in the city? What is the effect on the power grid?
To gain insight into this, the municipality has calculated the most affordable alternative to natural gas for existing buildings in Rotterdam. This analysis took future-proof options into account. The results of these calculations are presented on the Heating Program Map with Alternatives to Natural Gas (WAT Map), which shows, by area, which alternative heat source is the best fit.
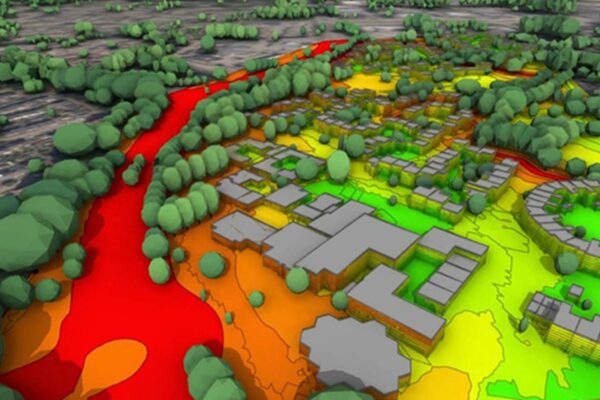
With a policy-aware digital twin , the impact of these conditions digital twin be considered holistically. Decisions are more aligned with the goals of all stakeholders involved, better substantiated, and, moreover, compliance with policy can be demonstrated. As a result, the water authority is better able to act appropriately and effectively, and monitoring and course correction become more feasible. The pilot focused on the water system in the Koekoekspolder area, with the focus later adjusted to also demonstrate the impact of solar parks in the area within the integrated model.
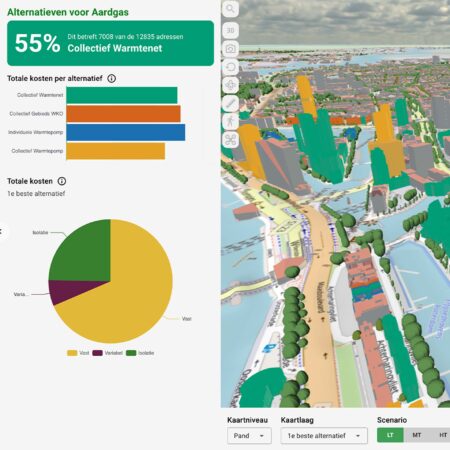
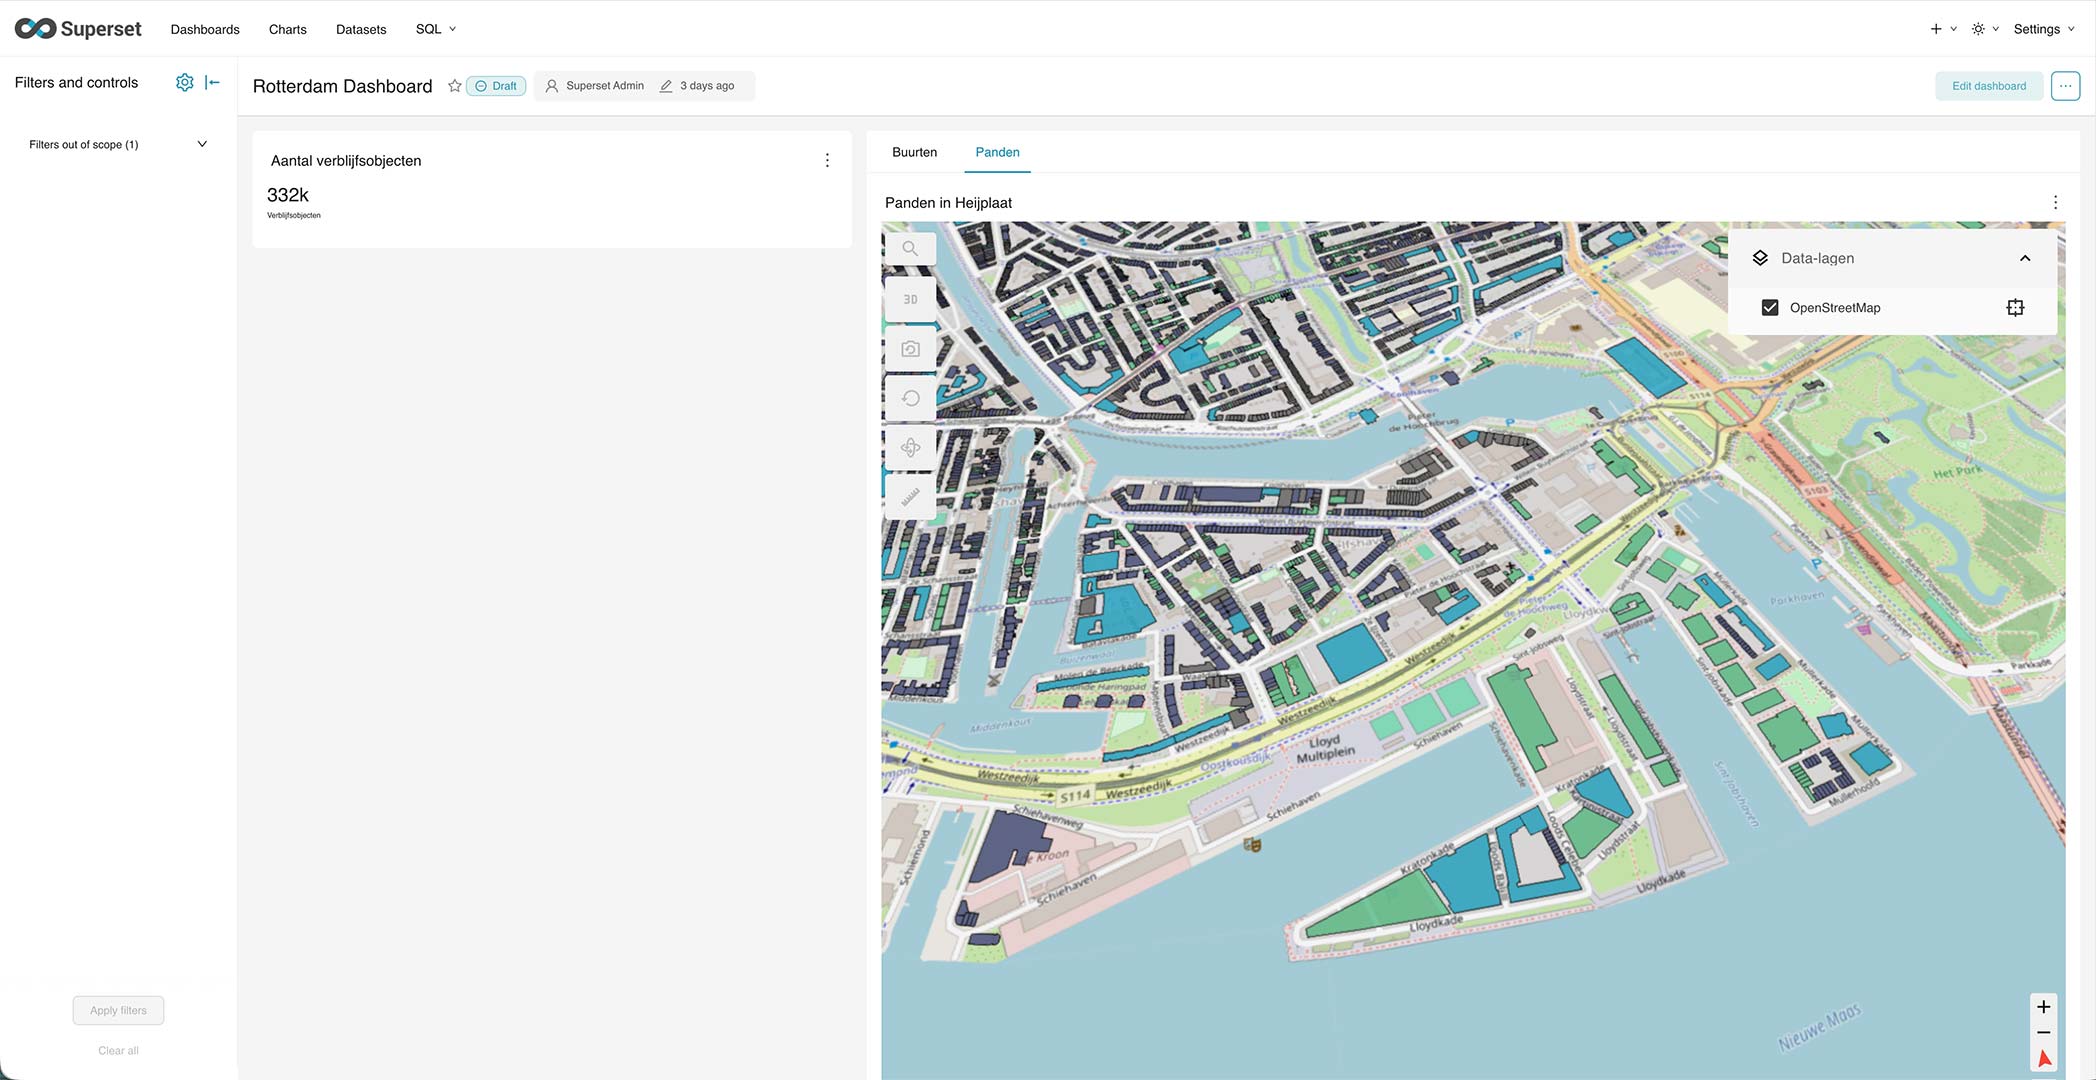
What is the WAT Card?
The WAT map (Heating Program with Alternatives to Natural Gas) shows the best alternative to natural gas. The map has previously been visualized in 2D, but the municipality wants to take it to the next level by converting the current 2D WAT map into a fully 3D information system for future heating and cooling systems.
This 3D dashboard helps determine which system is best suited for a particular area. The digital twin the City of Rotterdam better understand, analyze, and share the information from the WAT map with colleagues and partners throughout the city.
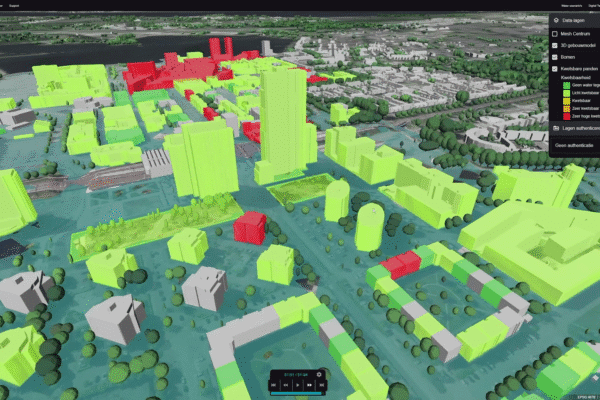
Information used in the 3D dashboard includes, among other things:
- Heat demand scenarios
- Cold demand scenarios
- Insulation Scenarios
- District heating networks, including heat sources, transmission lines, main intake points (MIPs), smaller transmission lines, distribution lines, sub-stations, and building connections
- Impact on the power grid
- Complexity of the subsurface
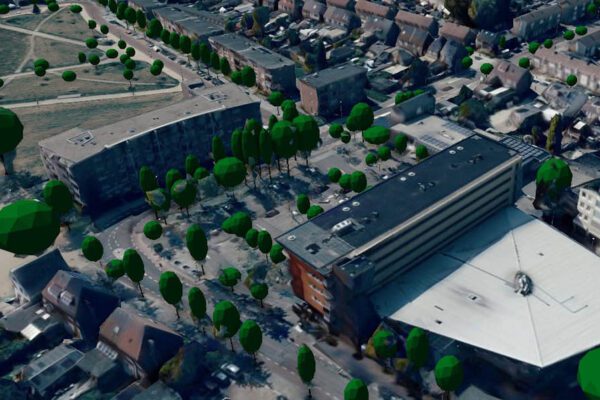
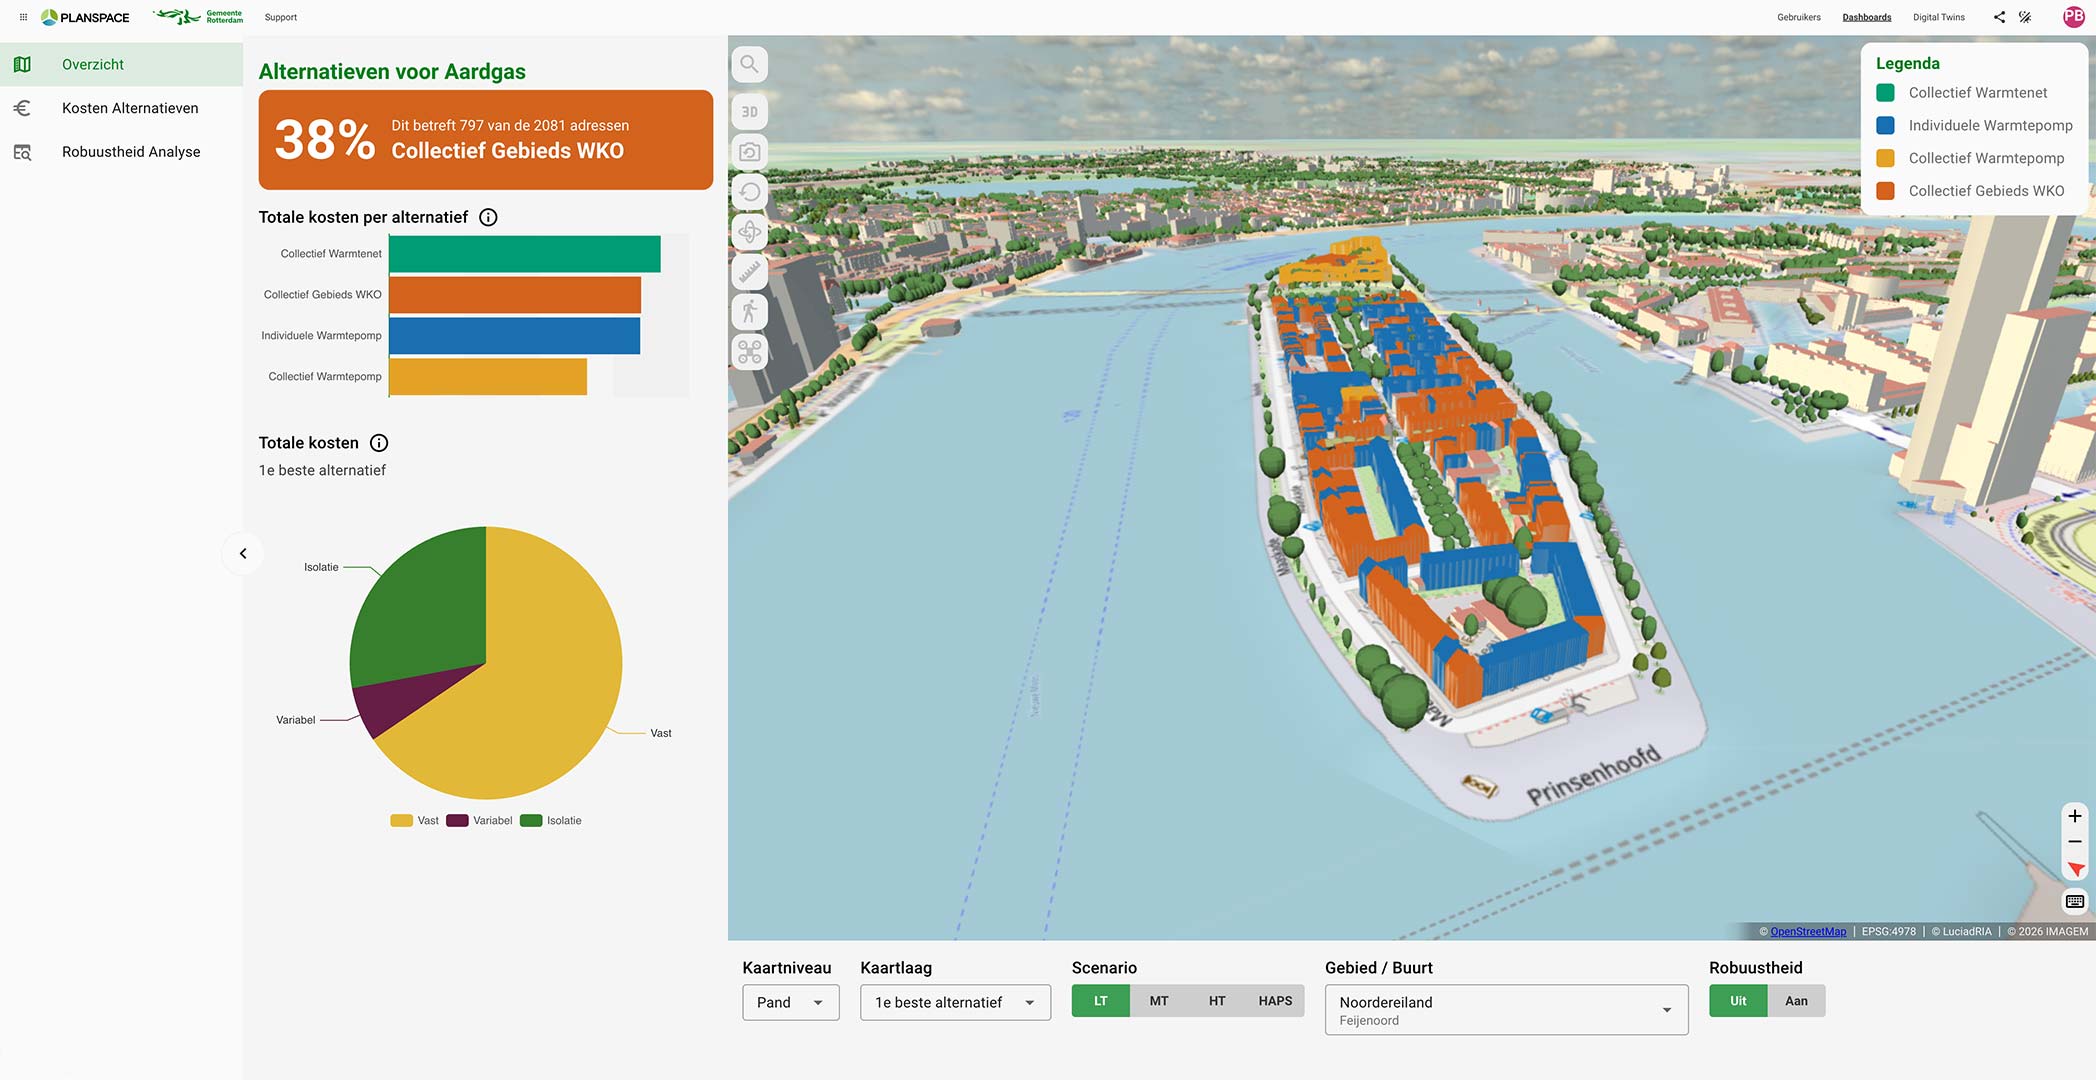
How the 3D WAT map works
Existing 2D business intelligence data and Rotterdam 3D data are combined into a single dashboard. This enables the municipality to inform internal and external partners as well as residents about the heat transition and its impact on the built environment, above- and below-ground space, and costs.
In addition, the dashboard helps the municipality better understand and analyze the WAT map, as well as collaborate with colleagues and partners.
The goal of combining 2D and 3D is to gain insights at different scales, making optimal use of both technologies.
Why use the 3D WAT map?
Greater insight and collaboration
The digital twin the municipality better understand and analyze information and collaborate with colleagues and partners.
Better decision-making
Outline potential solutions for alternatives to natural gas in certain parts of the city.
Controlling costs
Reducing failure costs by gaining insight into the subsurface.
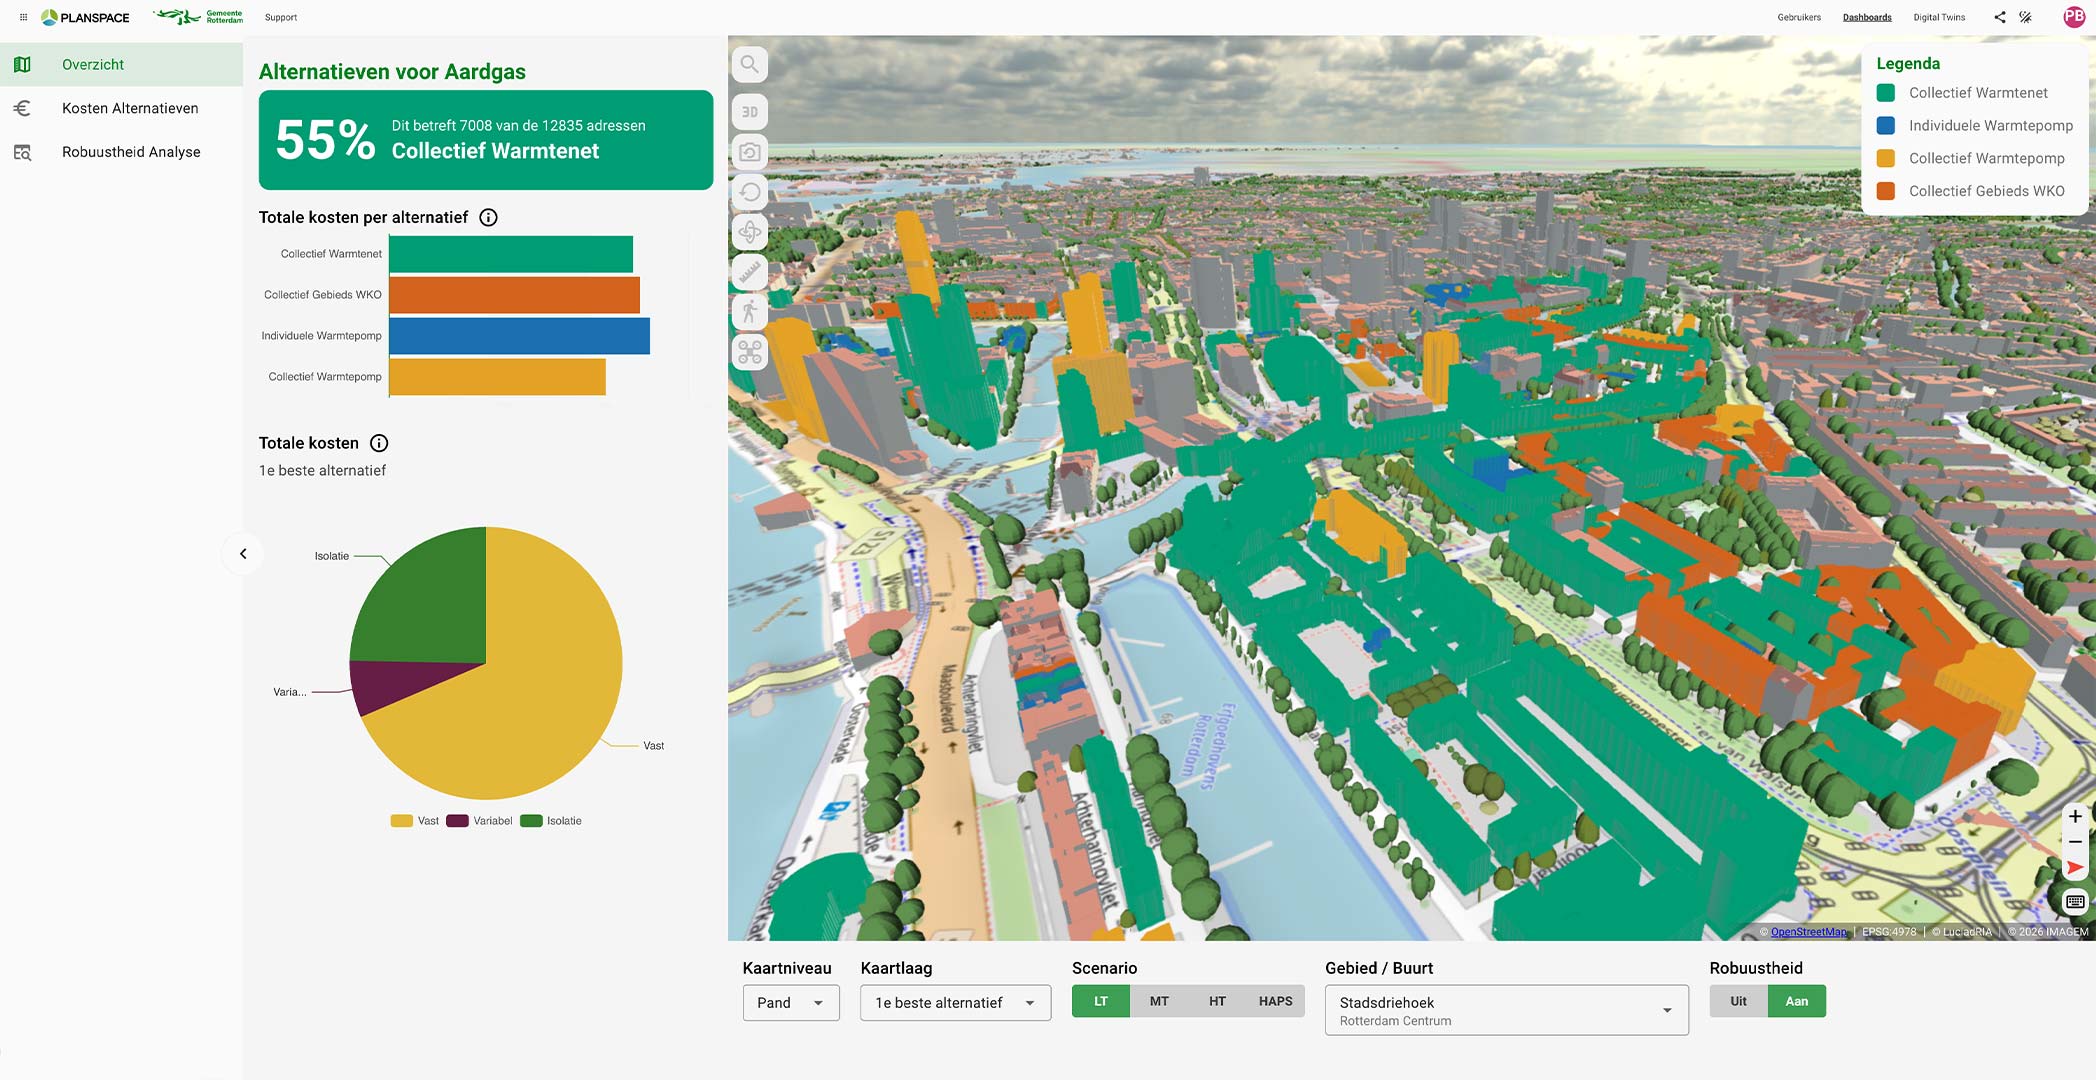
IMAGEM: The Power of Simulation
IMAGEM dashboard functionality in Planspace Simulator for the City of Rotterdam. The data analyzed by the business intelligence system can be combined with 3D data of both the surface and subsurface. The visualization provides a comprehensive view with the appropriate context.
More information
Niels is the Government Market Manager at IMAGEM. He helps government agencies continuously work smarter and more effectively, and fulfills his role by supporting organizations in solving their challenges. Want to learn more? Send Niels an email or send a message via our contact form.
Niels van de Graaf
Government Market Manager