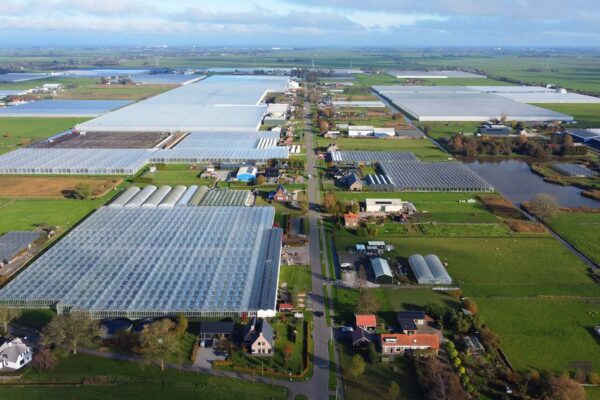
Municipalities face a growing challenge: how can we keep cities livable as traffic, housing development, and mobility continue to increase? Noise pollution is a key factor in this regard. To make sound planning decisions, municipalities need to know not only where noise originates, but also how it spreads throughout the city—for example, along building facades and across different floors of buildings.
However, within municipalities, it is often difficult to share noise data with other departments, even though area development specifically requires cross-departmental insights. Noise data only becomes truly valuable when it can be combined with other urban datasets, such as those on trees, buildings, traffic models, the BAG, and the BGT.
In a pilot project for the municipality of Almere, we investigated whether noise levels on building facades could be better segmented and made more transparent. Using remote sensing , noise data remote sensing enriched and then visualized in a 3D digital twin. This creates a spatial representation that not only provides insight into noise levels but can also be easily combined with other urban data.
From traffic count to noise model
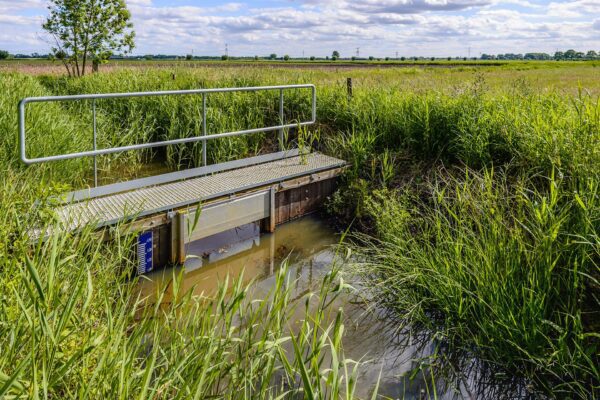
Remote sensing often associated with drones, satellites, and advanced radar technology. But even a simple sensor, such as a traffic counter that records the number of cars per hour, can form the basis for a spatial model with significant impact.
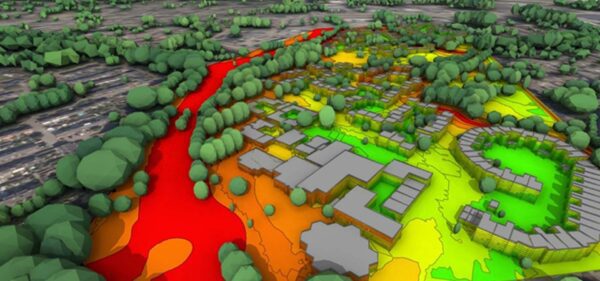
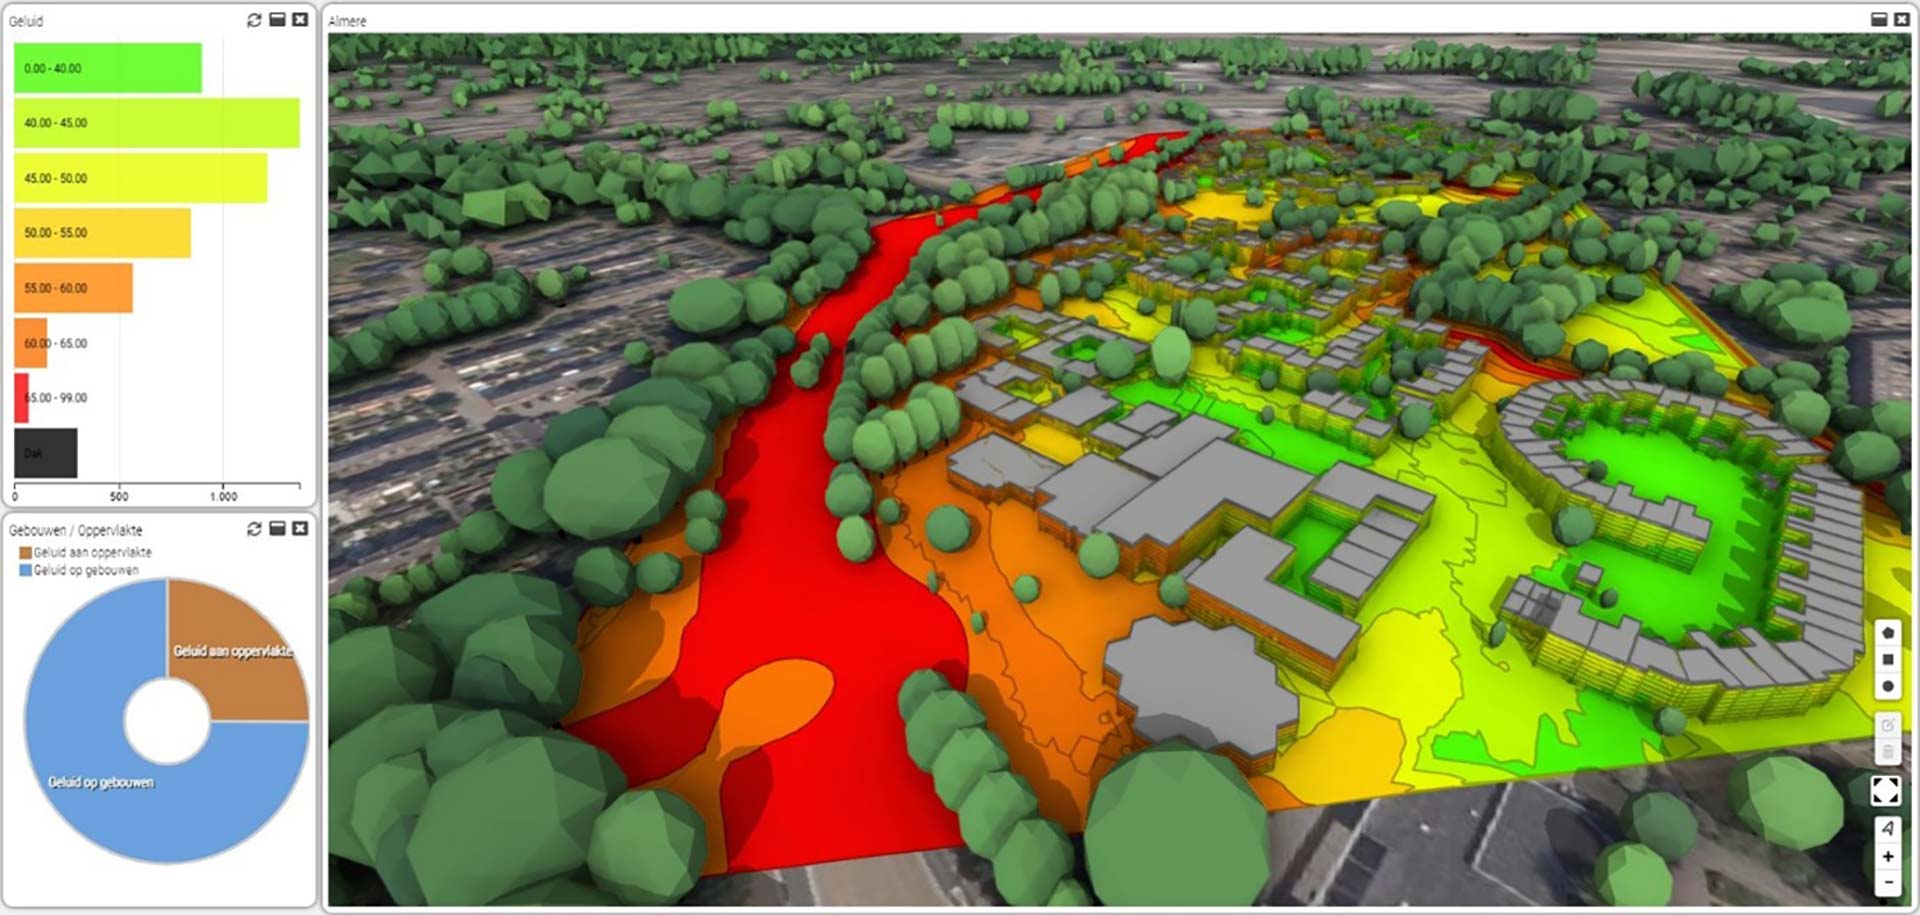
In Almere, traffic data is linked to acoustic models that calculate how sound propagates in the surrounding area. This creates a simulation of noise levels at various heights along buildings.
3D integration with building data
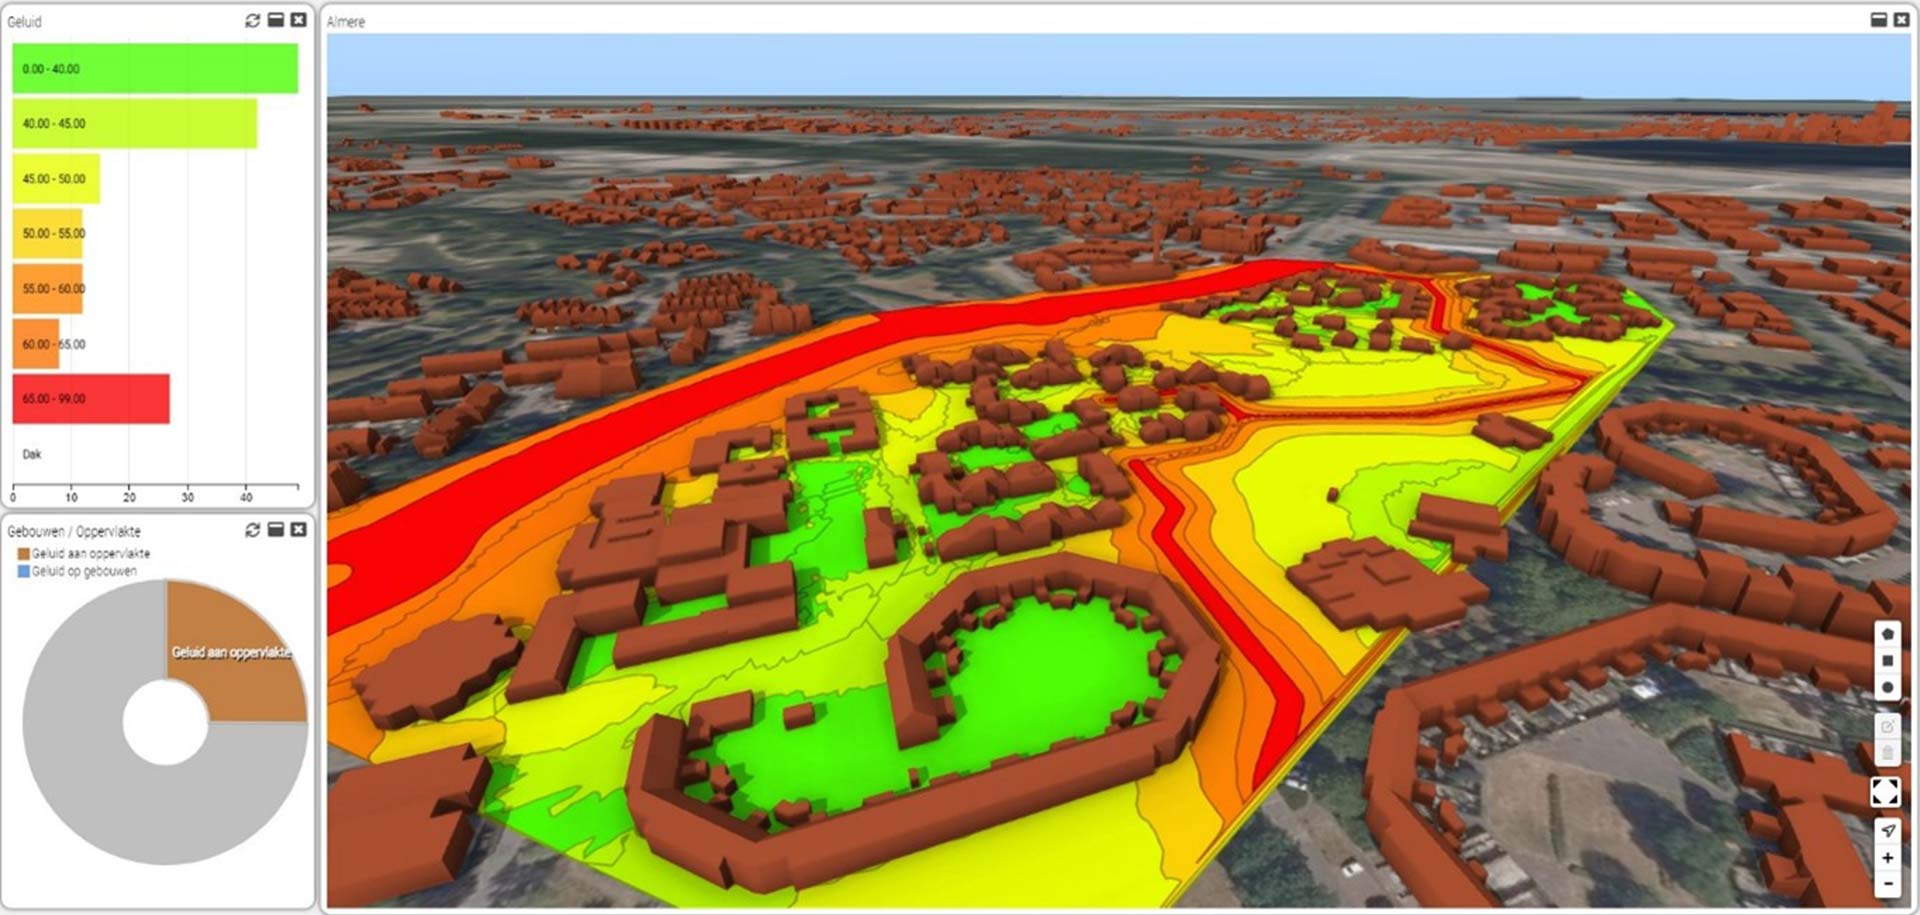
Combining noise data with building heights creates a three-dimensional model of noise exposure. This model shows the noise level in decibels for each building and height category.
A separate noise layer has been generated for every meter of height, from 1 to 10 meters. These layers have then been linked to the Large-Scale Topography Database ( BGT). This makes it possible to see how much noise a building receives on each facade and floor.

From data to insights
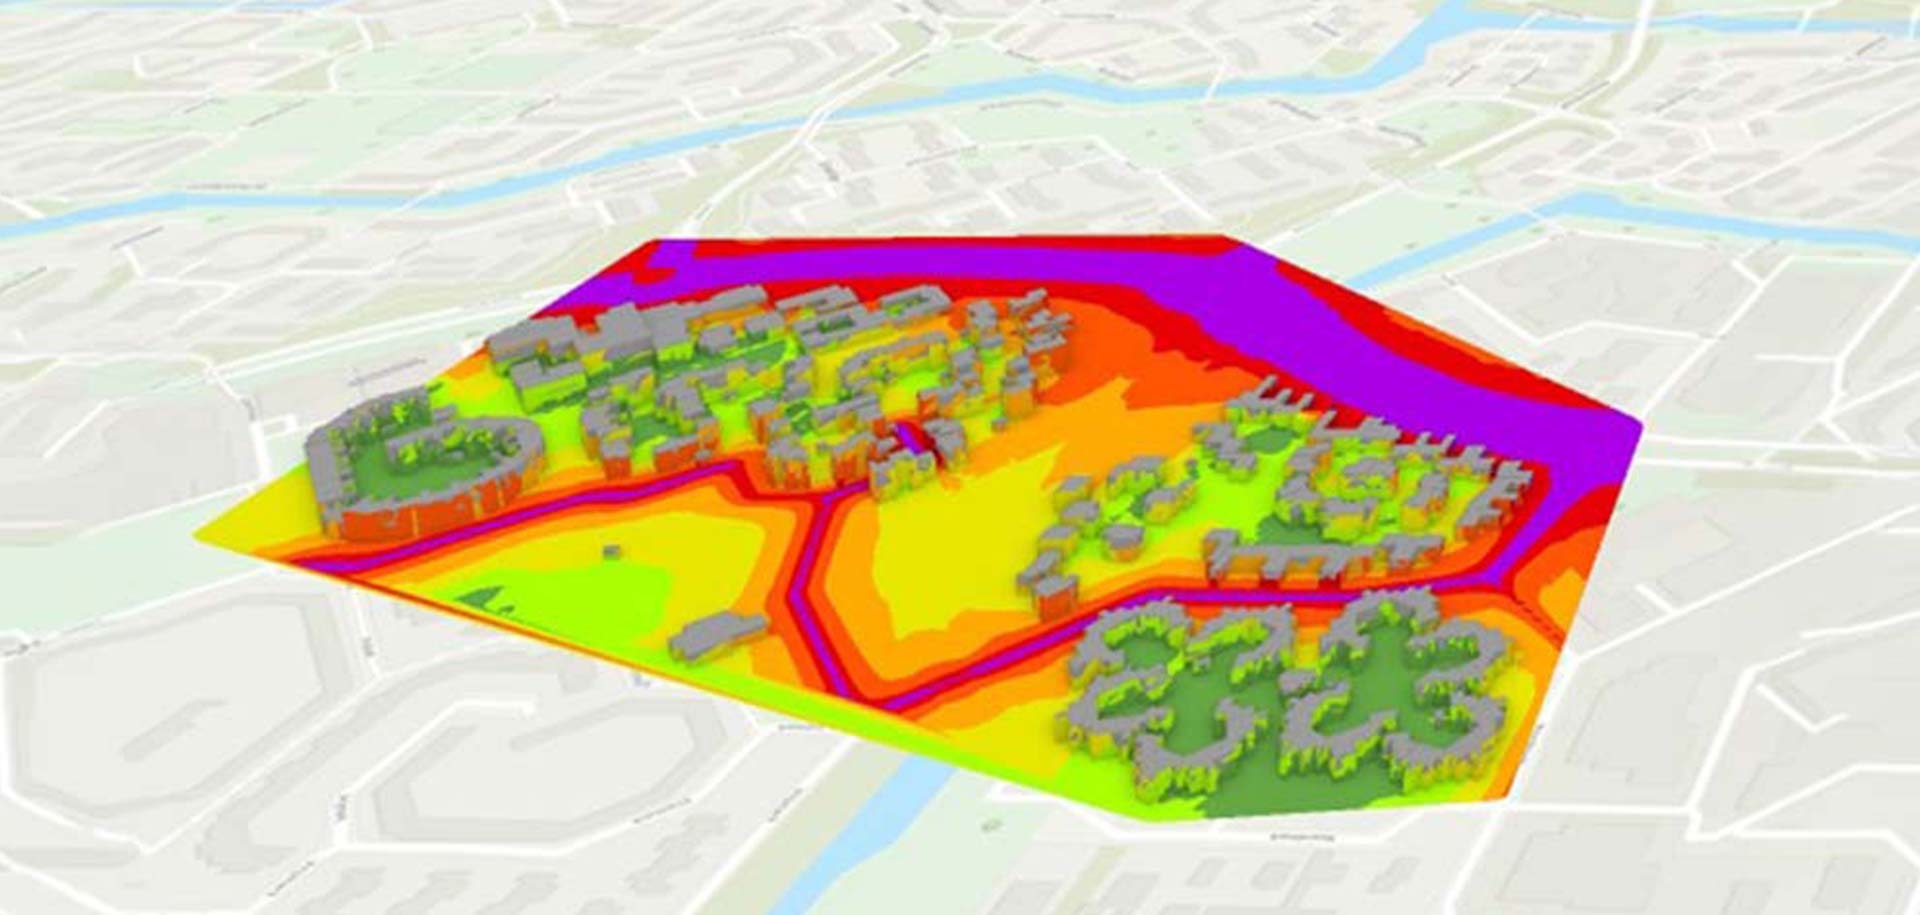
The results have been incorporated into an interactive map interface where users can select and analyze noise classes. The dashboard provides insight into:
- noise pollution per building
- noise level by height class
- Interaction with noise zones and decibel levels
This allows policymakers and planners to quickly identify where noise pollution occurs and which locations require special attention.
Why remote sensing this remote sensing ?
This case study demonstrates that remote sensing doesn’t always start with drones or satellites. It’s about collecting sensor data, modeling spatial patterns, and visualizing the impact on the living environment. By enriching relatively simple data with spatial context, a powerful tool for urban analysis and decision-making is created.
Applications of remote sensing
Land use planning
Understanding Noise Pollution in New Construction and Urban Development
Environmental Analysis
Monitoring and Analysis of Noise Pollution
Participation
Monitoring and Analysis of Noise Pollution
IMAGEM: From Data to Shared Insights
Within municipalities, it is essential that data is not only available but can also be shared across departments. It is precisely when information from different areas comes together that new insights emerge for urban development, mobility, and quality of life.
Visualization plays a key role in this. By making complex data easier to understand—for example, through a 3D digital twin—policy makers, specialists, and executives can more quickly grasp the situation and make better-informed decisions.
These are the kinds of challenges we tackle IMAGEM at IMAGEM . We don’t start with the technology; we start with the organization’s question: what insights are needed to make better decisions? By connecting data, conducting analyses, and clearly visualizing results, we help municipalities better understand their communities and accelerate decision-making.
More information
Niels is the Government Market Manager at IMAGEM. He helps government agencies continuously work smarter and more effectively, and fulfills his role by supporting organizations in solving their challenges. Want to learn more? Send Niels an email or send a message via our contact form.
Niels van de Graaf
Government Market Manager