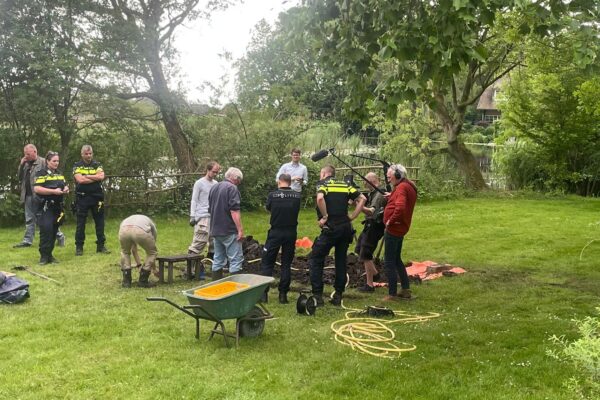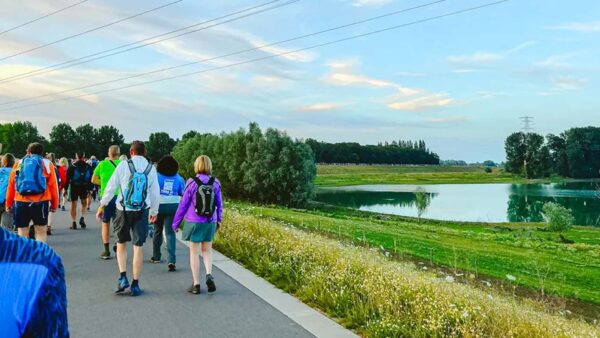

What is the connection between flood defense inspections and the Four Days Marches? It’s the number of kilometers that need to be walked. Flood defense inspections are often conducted on foot. The Netherlands has 17,691 km of primary and secondary flood defenses. These must be inspected systematically and at regular intervals (in accordance with the WBI2017 assessment framework). So put on your walking shoes.
Drones are increasingly being used for this purpose, but even in that case, you still need to “dispatch” someone to a specific location to operate the drone on site. Ultimately, someone also needs to analyze the drone footage, which can be a time-consuming or complex task in itself. But more on that later.
So when it comes to inspecting flood barriers, it would be particularly helpful if the inspector or enforcement officer didn’t have to walk as far, since they know where the high-risk areas are located. In areas where no high-risk areas have been identified, a less detailed inspection or one conducted less frequently would suffice.
How could you go about doing that? To be clear: this approach is not intended to suggest that we can make any claims about the extent of damage or deterioration, in any sense of the word. Rather, we are trying to identify high-risk areas that, at the very least, require a physical inspection.
Micro- and macro-stability
The inspection of a flood barrier primarily focuses on its resistance to hydraulic loads—in other words, can the barrier hold back the water? This resistance depends heavily on the barrier’s condition, which is why its condition must be checked regularly.
What can reduce the strength or stability of a flood defense? A distinction is made between macroscopic stability and microscopic stability. Macroscopic stability refers to a significant compromise of structural integrity. Examples include piping (water flowing under or through the dike), scouring at very high water levels, and subsidence.
When microstability declines, the effects are less immediately noticeable, but can have a correspondingly negative impact on stability in the long term. Examples include erosion caused by wind and water, infiltration, seepage, etc. Microstability, in particular, is highly dependent on the quality of the revetment’s surface covering.
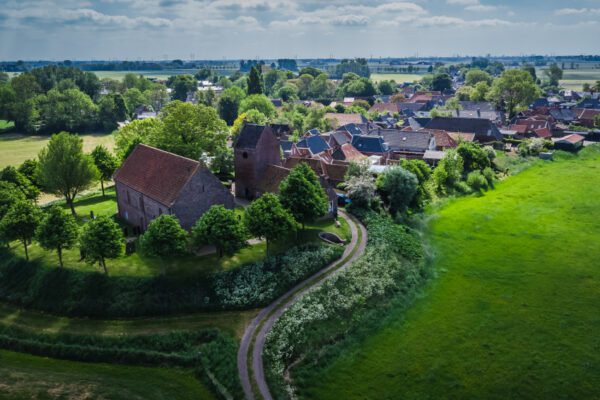
At the base of the embankment on the water side, the surface is usually made of stone or asphalt, but the crest and the inner slope are typically covered with grass. Grass provides good resistance, but only if it is of good quality in terms of root depth and density.
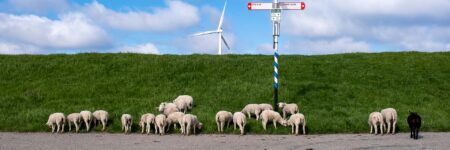
Excavation work, desiccation, overgrazing, and other factors can cause damage to the grass cover. This can lead to a decrease in the dyke’s microstability. At critical moments, dyke embankment material can be washed away due to overtopping, heavy rain, or other causes. Ultimately, this can lead to a serious weakening of the flood defense.
Identifying "problem" areas (defects) in the dike covering is, at the very least, an indication that a high-risk area exists or is developing there. It is therefore important to identify these areas in a timely manner and as thoroughly as possible.
Preliminary inspection using aerial photographs
This “assessment” is therefore usually carried out by an official who drives or walks along the dike, with or without the aid of drone footage. Given the total length of the flood defenses, this is a time-consuming task. Of course, nothing beats a physical inspection of every meter of the flood defense, but that comes with a price tag in terms of the availability of manpower combined with the right expertise. So in a situation of scarcity, it is important to utilize that available capacity as optimally as possible by, in particular, inspecting high-risk areas.
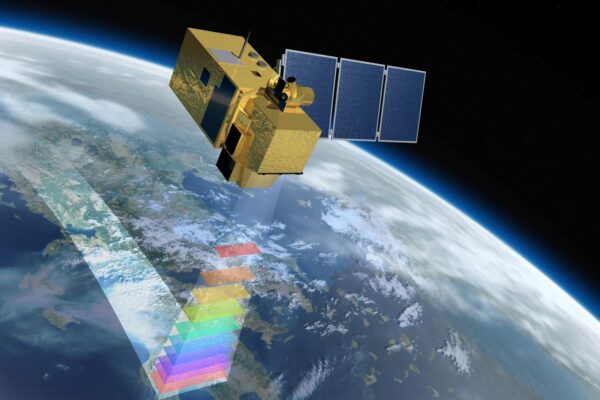
And here we can give the inspector a hand by providing him with the right tools. Tools that automatically identify high-risk areas based on aerial photos, drone footage, or satellite imagery using advanced algorithms.
How does that work?
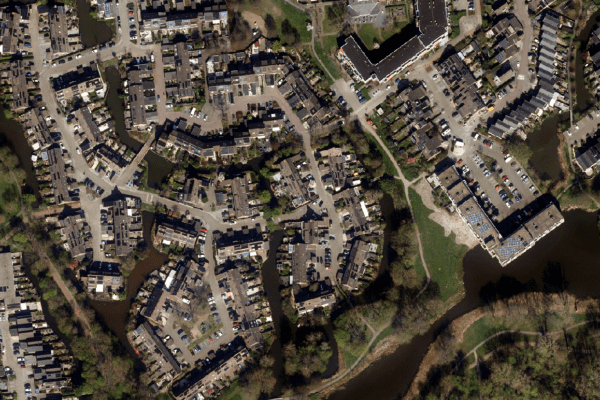
First and foremost, it is important to have high-quality images of the area to be inspected. And what do we mean by "high-quality"? The higher the resolution, the greater the level of detail that can be observed.
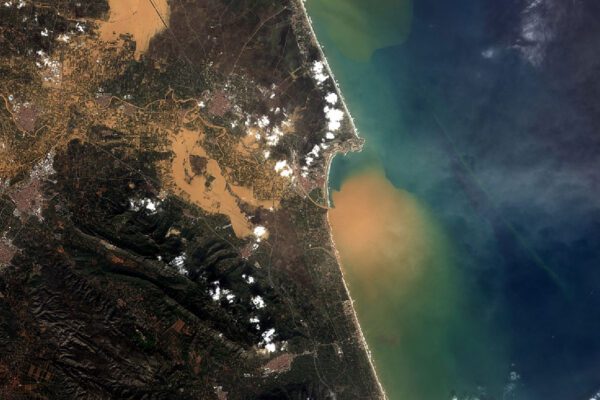
So a 5-cm aerial or drone image is better than a 50-cm satellite image, but the latter can capture larger areas at once. With a 5-cm resolution, the smallest deviations you can detect are between 5 and 10 cm.
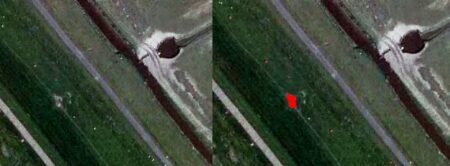
The example below shows an aerial photo with a resolution of 10 cm, depicting a section of a levee where sheep are grazing and a "bare" spot is visible in the center. The image on the right shows the result of a so-called "grass index analysis." It is clear that the algorithm has identified the bare spot. A few sheep were also detected, but you can filter those out later.
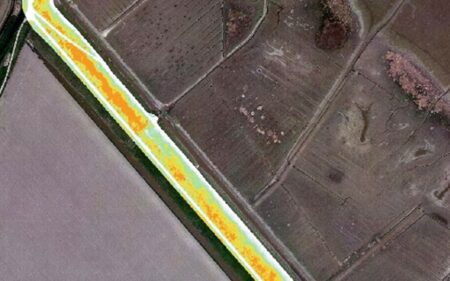
How did we arrive at this result? By analyzing the image’s color channels (RGB) and converting them into a normalized grass index. This is shown in the following image. A ‘grass’ index has been calculated and visualized for that section of the dike. The deeper the yellow color, the higher the quality of the grass cover. It is clearly visible that there are areas of poorer quality, and where the color is white, there is little or no grass present.
Based on a low “grass index” value (low grass coverage), areas of a minimum size are filtered out. The result identifies areas along the entire dike that require at least further examination—either through the survey itself or, at the very least, during a field inspection.
I have access to aerial photos. Can I perform a "grass analysis" myself?
That is certainly possible. IMAGEM made it easy to perform remote sensing grass analysis without specialized knowledge of remote sensing . The entire analysis is incorporated into a single model. The model can be run in the ERDAS desktop application. The user simply needs to press a button to activate the model. The model requires input in the form of an aerial photograph and asks the user to set the algorithm’s “strictness” level. After running the model, the weak spots are identified. These can be synchronized to a dashboard or mobile app, or tracked in a vector file within a GIS application.
Conclusion
Grass cover is very important for the microstructural stability of a flood protection structure. Visually inspecting flood protection structures can be time-consuming. The use of imagery (from drones or aerial photographs) makes it possible to quickly assess sections of the dike. By using a grass index analysis incorporated into a model, it is easy to automatically identify problem areas in a dike body. It is not a replacement for a physical inspection process, but it does make it possible to carry out the inspection process in a more targeted and therefore more efficient manner. A pleasant side effect of this is that the inspector or enforcement officer will need to buy new walking shoes less often.
More information
Tjip is a business consultant at IMAGEM. As a consultant, he helps organizations—such as water authorities—find answers and solutions to spatial challenges, where the key lies in the smart application of location intelligence. Want to learn more? Send Tjip an email or message us via our contact form.

Tjip van Dale
Business Consultant