
Severe mudslides struck the Valencia region. But how do you analyze a disaster area like this if you don’t have pre-flood imagery? That question was the focus of a challenging knowledge week with students. Using satellite data, the Flood Mud Index (FMI), and advanced image processing in ERDAS , we developed a smart and fast analysis method. This allowed us to detect mudflows using just a single satellite image—crucial in situations where time, resources, and information are scarce. The result: a visually powerful map that not only shows where mud is located, but also how much. A method that is immediately applicable in emergency response, recovery planning, and even military operations.

Why this analysis?
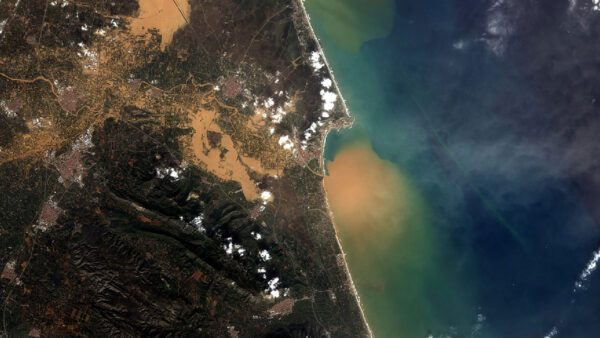
The floods triggered large-scale mudslides that threatened infrastructure, agricultural areas, and urban areas. A rapid understanding of the extent and spread of these mudslides was essential not only for emergency responders on the ground but also for strategic planning and recovery efforts.
Detecting change using a single satellite image
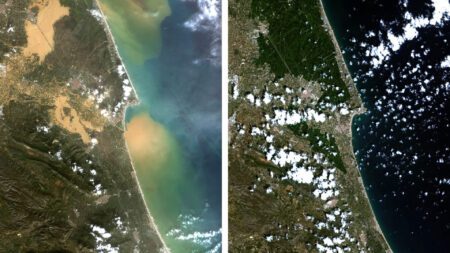
Normally, you use multiple images to detect changes—one taken before an event and one taken after. But in emergency situations, every minute counts, and collecting and analyzing multiple datasets is often too slow. Because speed in data processing is crucial, we took a different approach in this project. We developed a method that allows you to gain reliable insights using just a single satellite image. This saves time in collecting, preprocessing, and analyzing data—and it is precisely that time that counts in emergency situations.
Flood Mud Index (FMI): Understanding Mudflows
Existing indices such as the NDWI (Normalized Difference Water Index) work well with clear water, but fall short when dealing with muddy water containing a lot of sediment. That was precisely the problem during the extreme flooding in Valencia. The solution: the Flood Mud Index (FMI), developed by Emanuele Alcaras (University of Genoa). This new index is designed to identify muddy areas using just two spectral bands from a satellite image: red and blue. The FMI index excels in simplicity and precision. In our tests, the index achieved an impressive accuracy of 97.86%. And because only RGB data is required, you can also apply the method to inexpensive drones or in cloudy weather conditions.
Built in-house using ERDAS
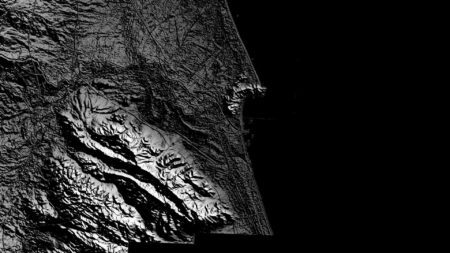
The Flood Mud Index is not included by default in ERDAS , but we were able to easily build the model ourselves using Spatial Modeler. By combining the index with RGBI coloring and a two-meter resolution digital elevation model (DEM) of Spain, we created a powerful visual representation of the flood and its consequences.
From an index to a visually striking map
It’s good that the muddy areas are clearly highlighted; that provides clarity. But now we’d also like to see exactly where it’s muddier or less muddy. We’ll incorporate this index in the next step.
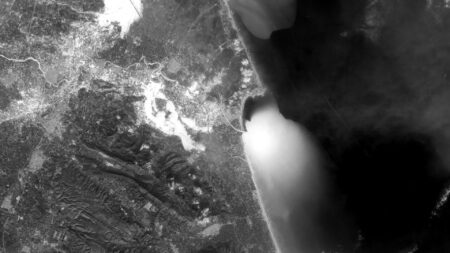
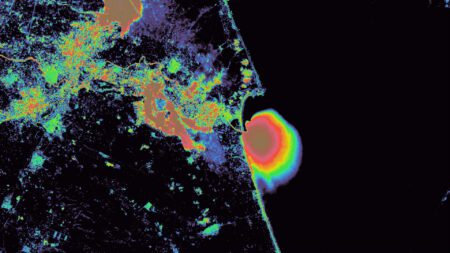
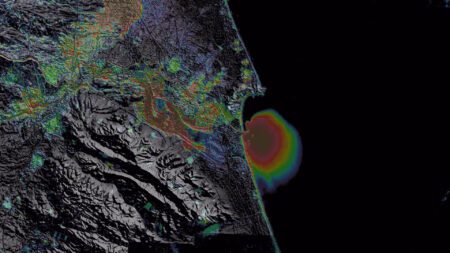
To visualize the mud even more clearly, we added an additional analysis tool: the FMI index was combined with a multispectral image using the RGBI (Red-Green-Blue Index) function. This process integrates the brightness values from the index with the color information from the satellite data, thereby adding an extra step to the analysis. Creating an RGBI Shaded Relief. This is a function available as standard in Erdas and, because the images have already been analyzed, requires virtually no processing time.
From clear “areas” in the image, we move on to a color image, where the darkness of the color reflects the intensity of the sediment concentration. The image below shows the area just south of Valencia, near Cullera. We can see how muddy the Júcar River is. Clearly visible is the outflow of sediment into the Mediterranean Sea at the mouth of the Júcar near Cullera. We overlaid this result as a transparent layer on a Digital Elevation Model (DEM) with a resolution of 2 meters. This DEM is available for free via the Spanish Geoportal. This final map provides a clear picture of the flood impact, a valuable tool for both civil and military applications.
From a pilot project to an operational model
What began as a practice case has now been incorporated into Erdas . This allows others to benefit from the innovations and insights gained during this knowledge week.
Want to know more?
Would you like to learn more about this topic? Send Harald an email.

Harald Görtz
Business Consultant