
How aerial photos and modern data uncover a hidden World War II story
On January 2, 2025, the Central Archive for Special Judicial Proceedings (CABR) opened its doors. This archive contains information on some 425,000 people who were suspected of collaborating with the German occupiers during World War II, as well as the stories of their victims. NOS reporter Lex Runderkamp delved into this unique archive to investigate what happened during the war. In the first episode, titled “Resistance,” he follows the trail of a woman who was executed during the war. Rumor has it that she is buried at the site of an old ditch—a ditch that has long since disappeared. Harald Gortz, a geodata specialist, helps to make this ditch visible again using historical aerial photos and modern data. In this blog, you can read step by step how he does it.
A hidden story in the backyard
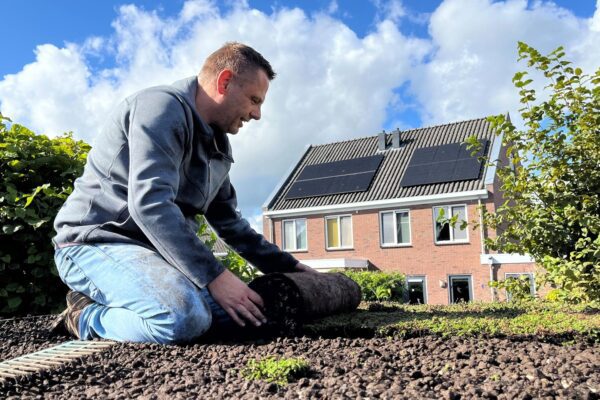
How it all began. In the backyard of a vacation home in the Alblasserwaard, a mystery is circulating: a woman who was executed during World War II is said to be buried here. The clue? “Don’t dig where the old ditch used to be.” But that ditch has long since disappeared.
Determined to find out what happened in his backyard, history teacher Niels de Bruin teams up with documentary filmmaker Lex Runderkamp to delve into the CABR archives.
They discover that an execution did indeed take place in March 1945 and that the woman is said to have been buried in the backyard, where a ditch used to run. But how do you pinpoint the exact location of a ditch that no longer exists?
Geodata as a time machine
This is where Harald Gortz, a geodata specialist, comes into the picture. Using a combination of historical aerial photographs and modern data sources, he reconstructs traces that have disappeared. Here’s how Harald went about it:
- 1. Georeferencing RAF imagery
Aerial photographs from 1944 and 1945 are combined with current maps. This process begins with precisely positioning the images so that they align perfectly with one another. - 2. Digitizing vanished ditches
Now that the images are correctly positioned, Harald can map the ditch pattern from that time. - 3. Checking weather statistics
To rule out any distortions caused by frozen ditches, Harald analyzes the temperatures from that period. - 4. Revealing Elevation Differences
Using the Actueel Hoogtebestand Nederland (AHN), he reveals subtle undulations in the landscape. What does he find? The old pattern of ditches from 1944 is still recognizable. - 5. Using ground-penetrating radar
Now that we have a clear picture of the old ditch pattern, we can conduct a targeted search using ground-penetrating radar. What is “hidden” in the ground? - 6. Digging into the ground
At the locations where we found anomalies in the ground, we’re digging in. What will we find?
Step 1: Georeferencing the RAF images
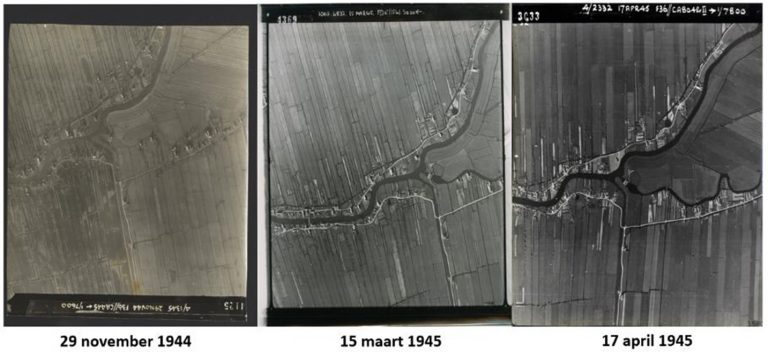
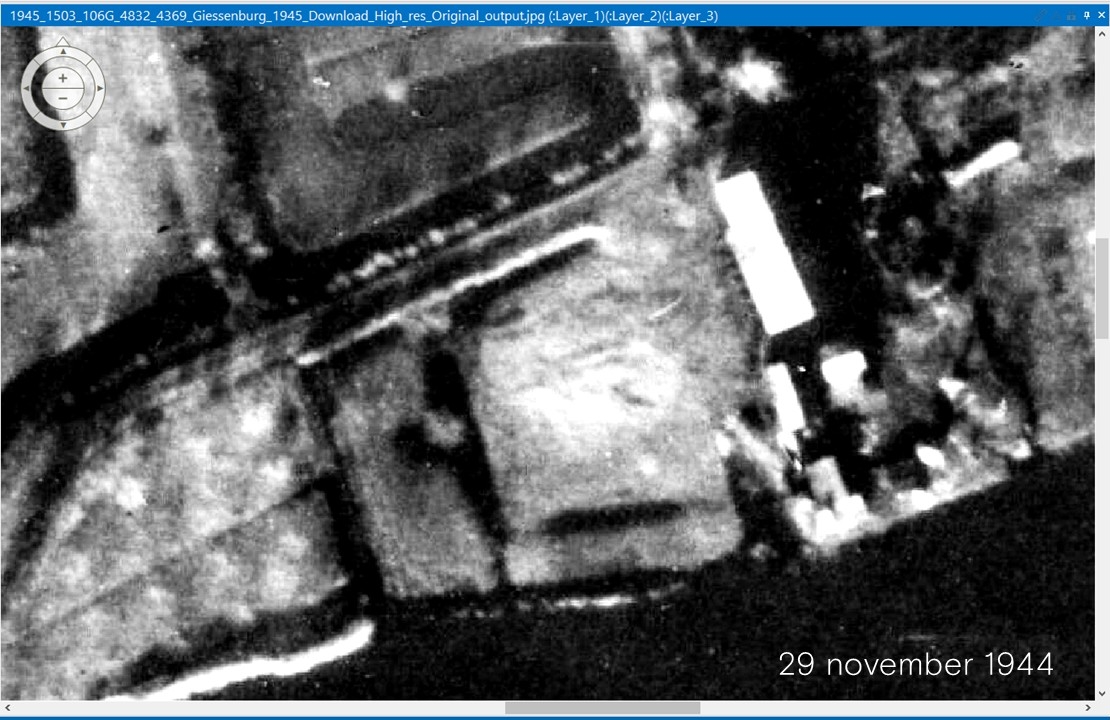
During the war years, the Royal Air Force (RAF) took aerial photographs of the Netherlands. These images, originally intended for military intelligence purposes, offer a unique glimpse into the Netherlands of that time. Harald has selected images from 1944 and 1945, taken around the time of the execution.
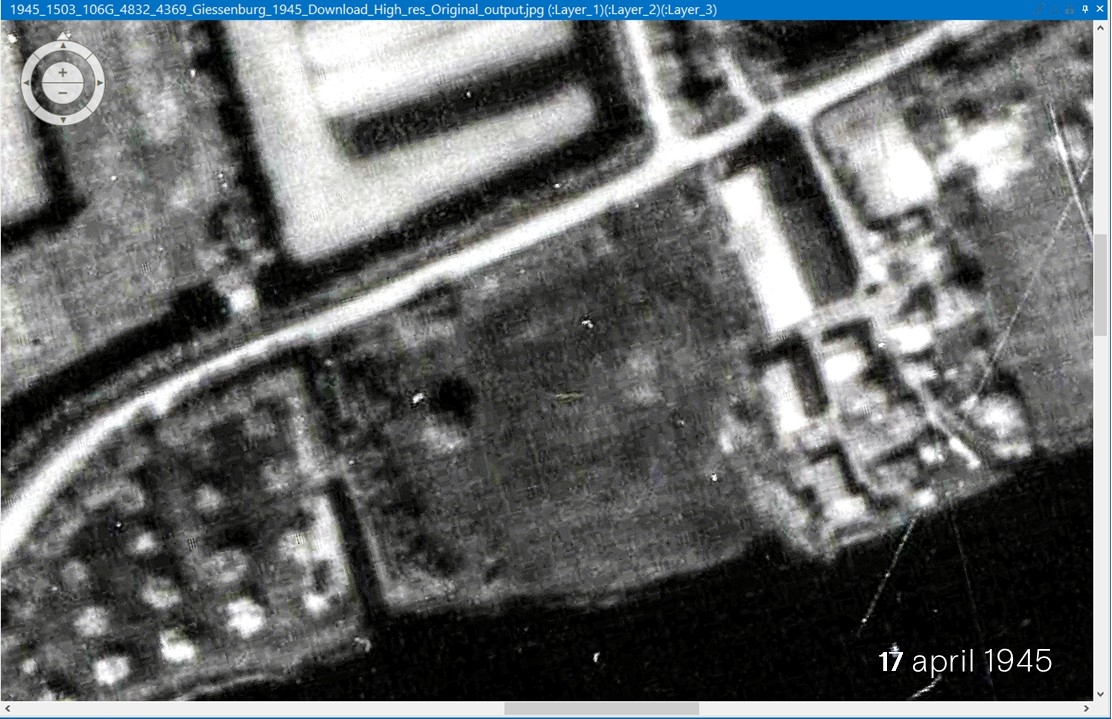
To overlay the RAF images above onto current maps, Harald uses georeferencing: a technique in which historical images are aligned with modern coordinates.
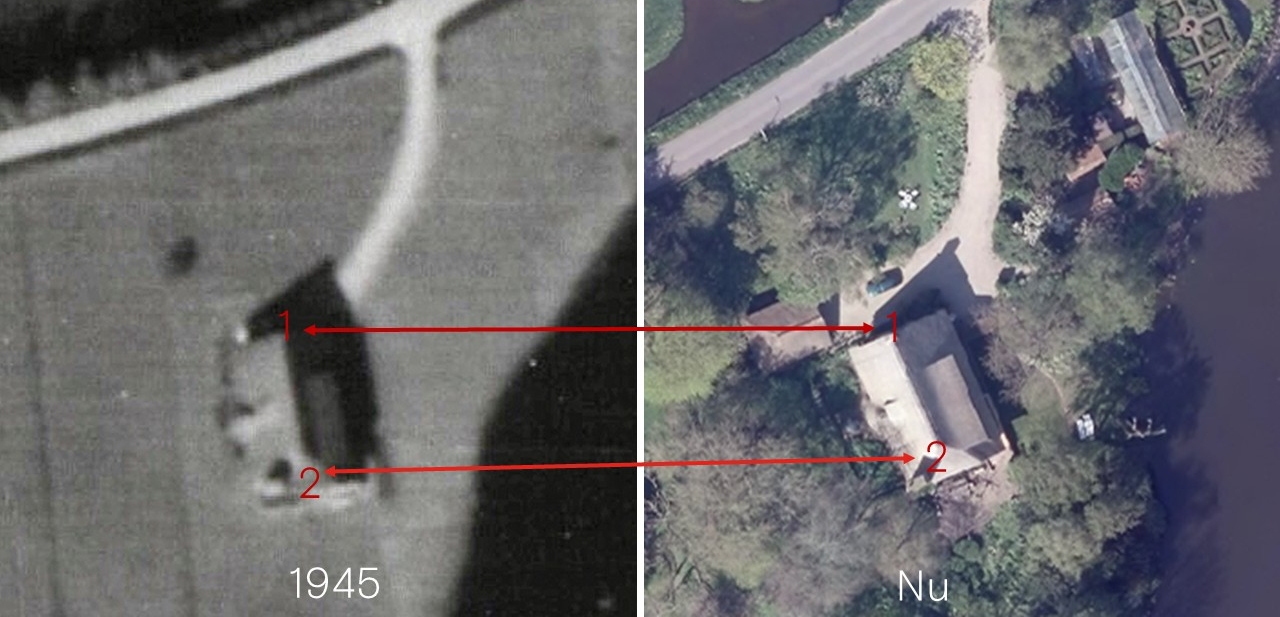
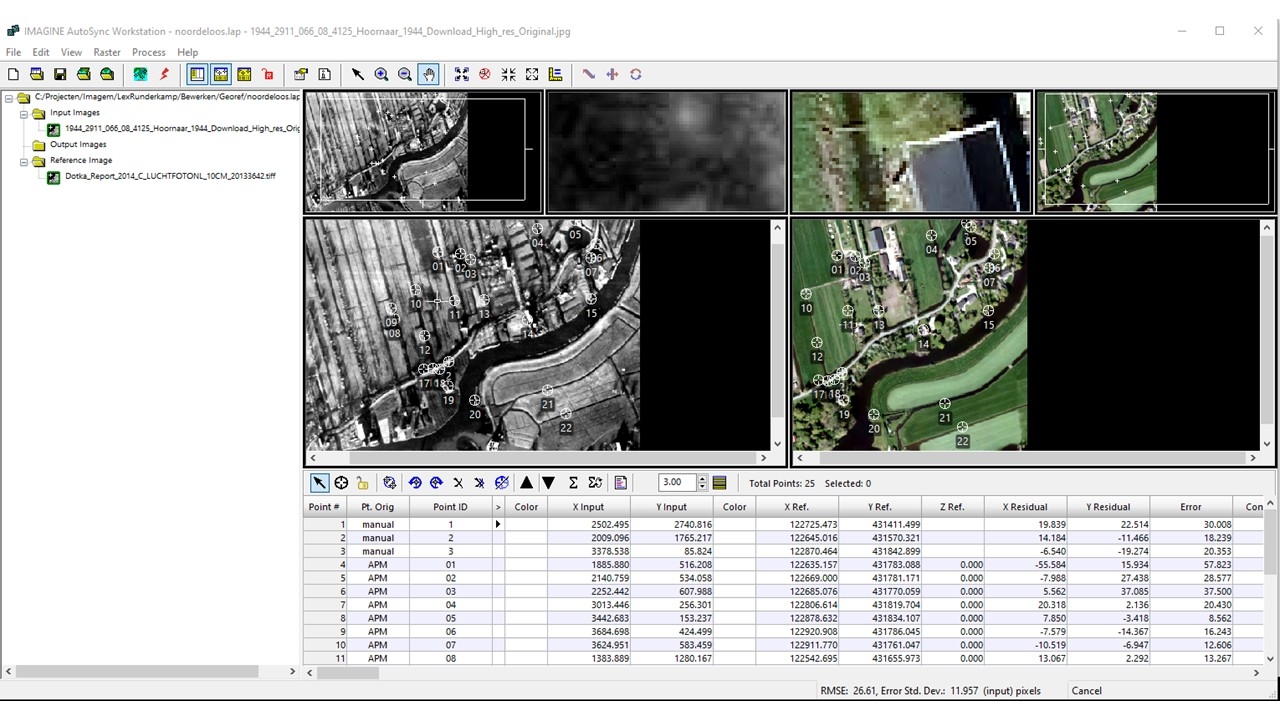
Using software such as ERDAS , Harald identifies corresponding points, such as the corners of houses, and precisely positions the images (Figure 04). This is easier than you might think. The computer assists in the process; once Harald has marked more than four points, the computer “helps” by searching for corresponding points (Figure 05). This makes it possible to seamlessly overlay the historical situation onto the current map.
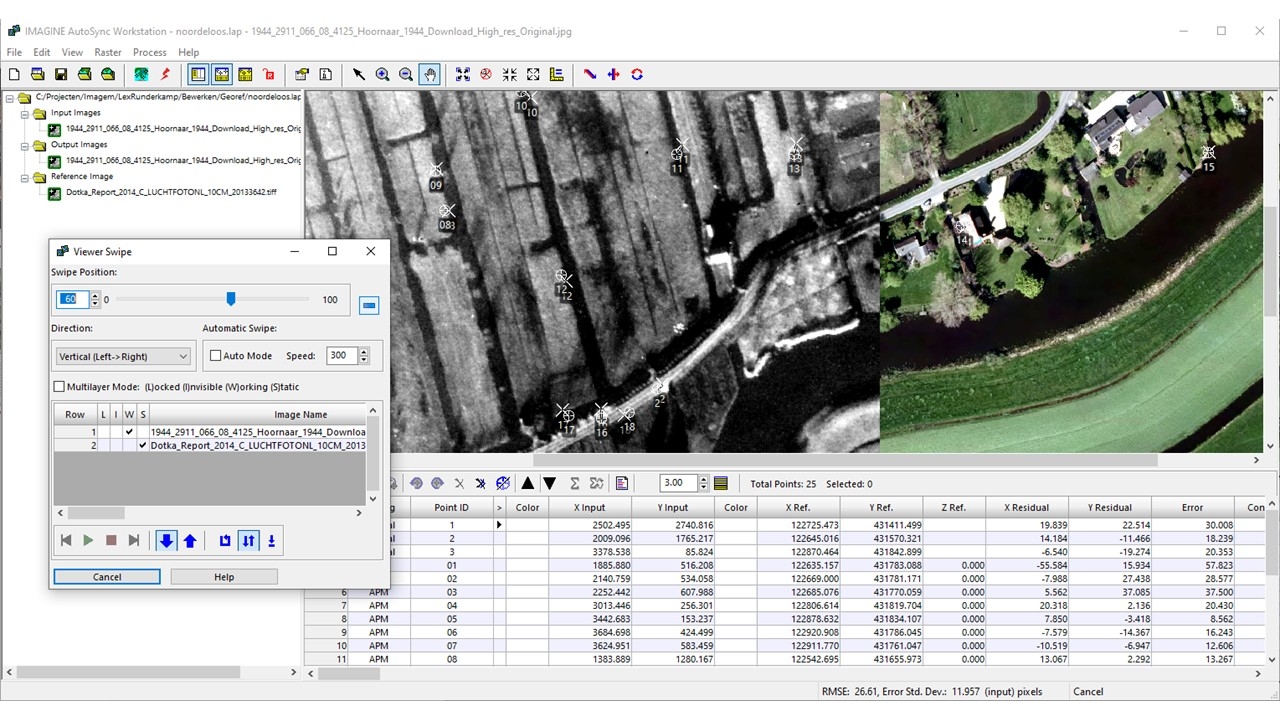
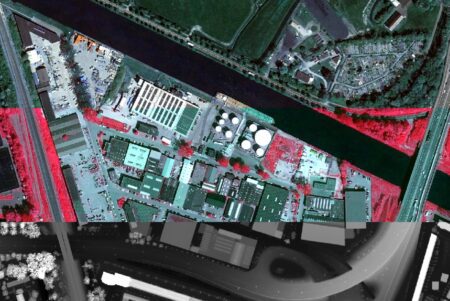
In Figure 06, you can see how the historical image from 77 years ago overlaps with the current image, highlighting the differences between then and now.
Step 2: Digitizing watercourses using the BGT
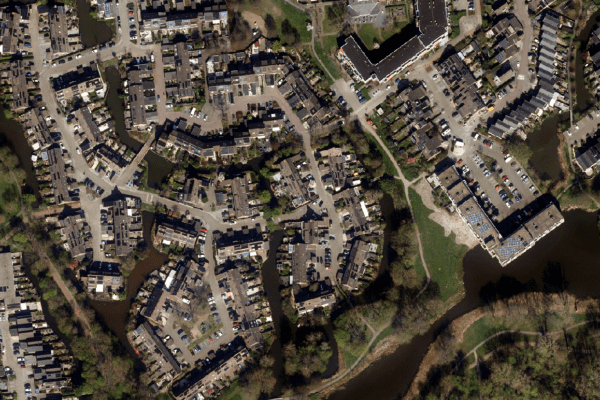
Using the georeferenced images, Harald will begin working with the Large-Scale Topography Database (BGT). This modern dataset shows all current ditches, roads, and houses in the Netherlands.
Using the aerial photograph from 1944, Harald is able to accurately digitize the location of the old ditch. He can then combine these locations with current data. He also compares this location with the images from 1945 (Figure 07) and discovers that the ditch became less visible during that period, possibly due to earthworks.
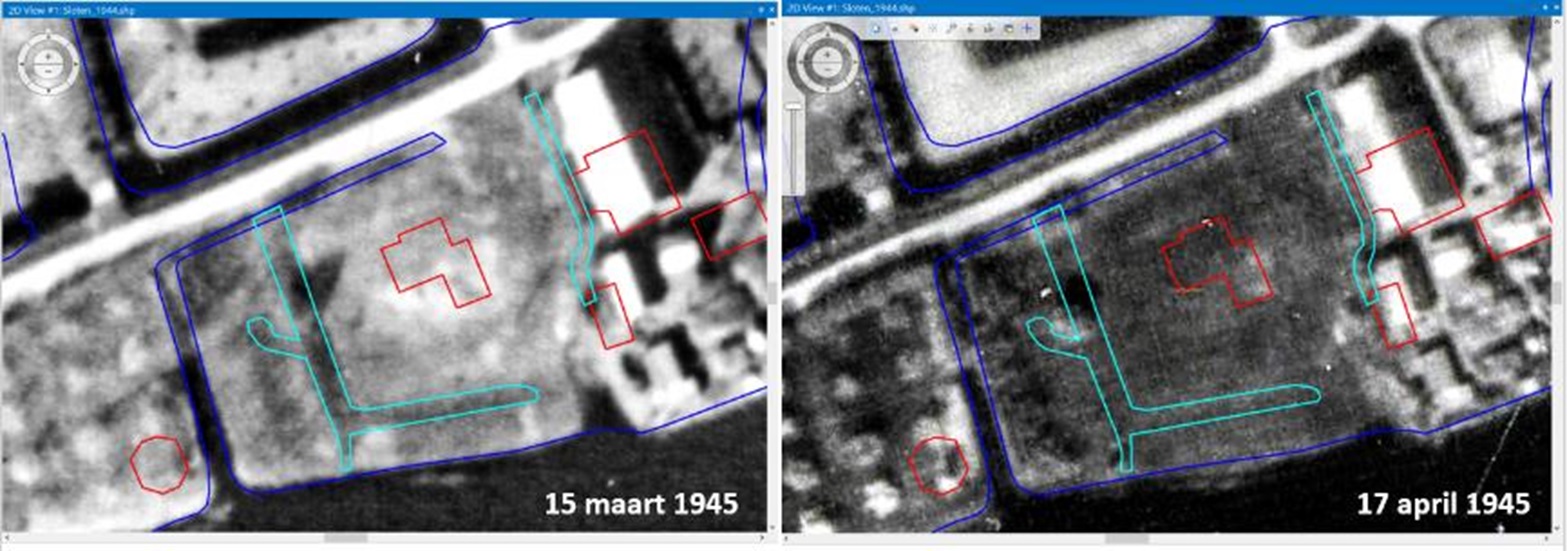
Step 3: Check weather statistics
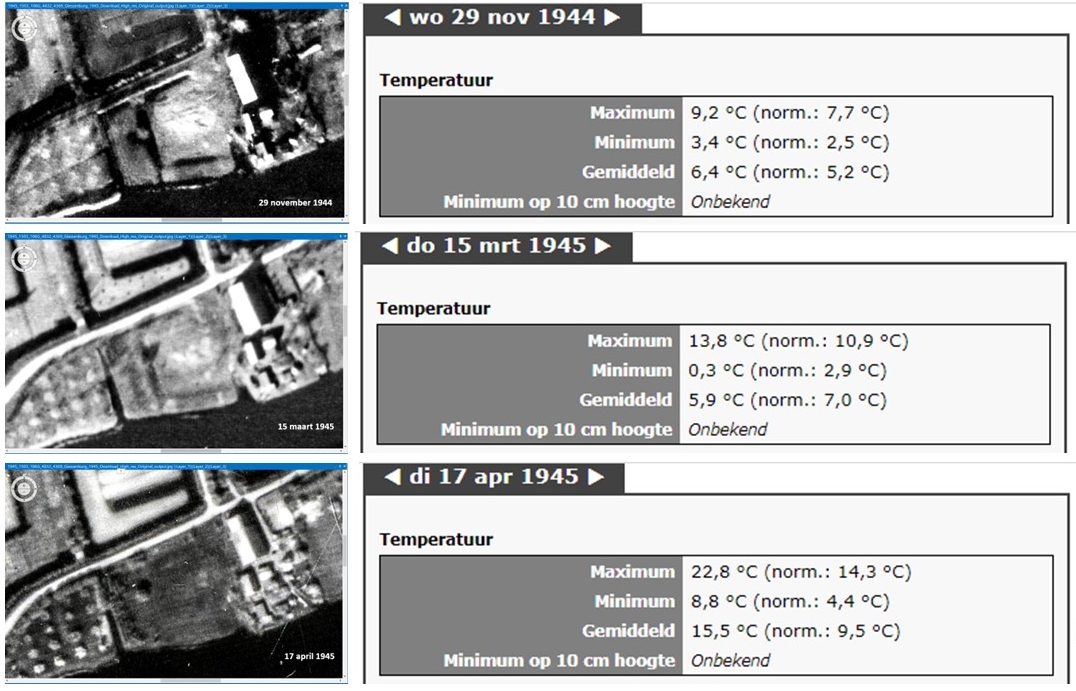
Were the ditches possibly frozen at the time the aerial photos were taken?
To confirm his findings, Harald checks the historical weather data (Figure 08). The weather statistics show that temperatures were well above freezing. This allows Harald to rule out the possibility that ice obstructed the view of the ditch. The changes in the terrain around 1945 suggest human activity instead.
Step 4: Analyzing Elevation Differences Using AHN
Using the Current Elevation Database of the Netherlands (AHN), Harald maps subtle differences in elevation. These differences often provide clues about old ditches and other historical features.
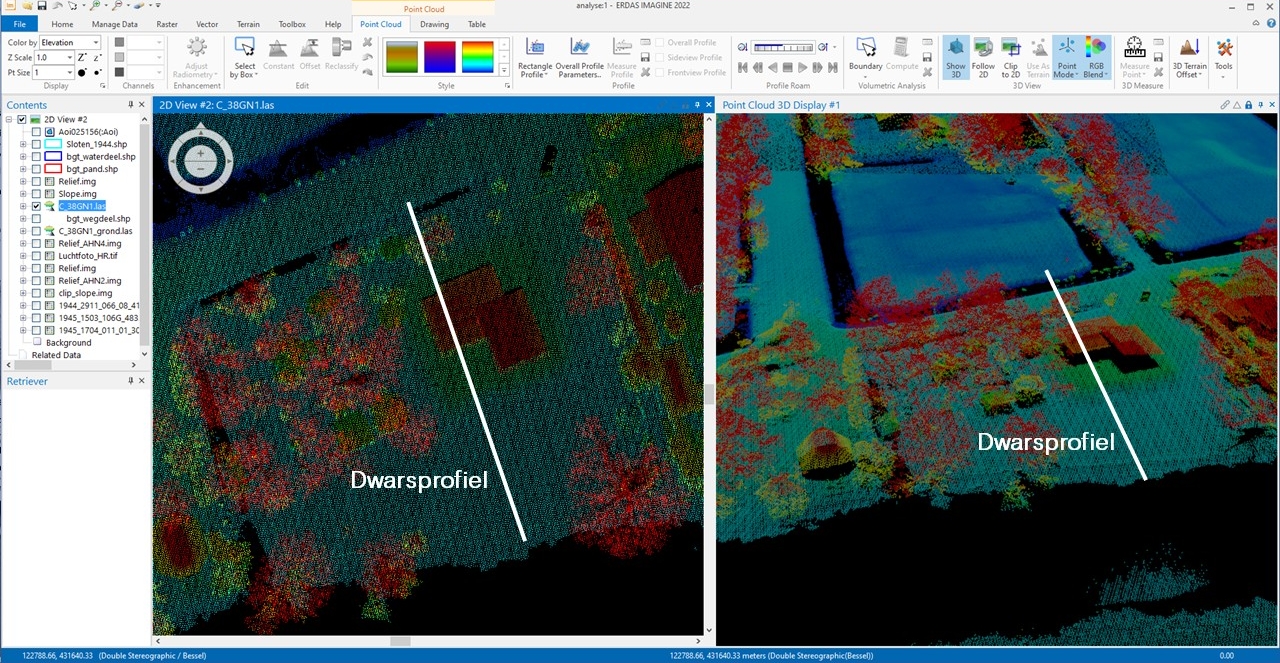
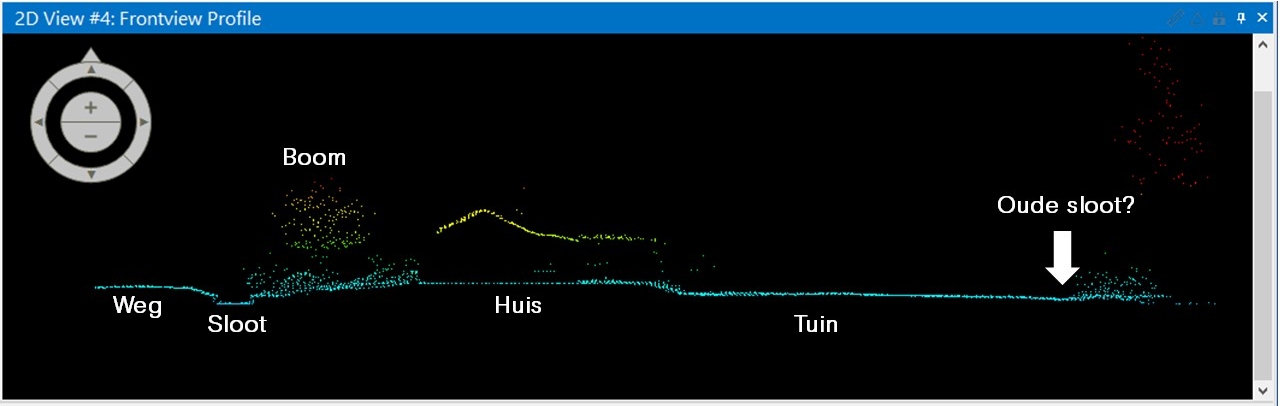
By creating a cross-section (Figure 10), he discovers that the old ditch is still visible as a slight depression. Using point clouds, Harald creates a 3D model of the terrain, which allows him to reconstruct the contours of the 1944 ditch.
You can see that the ditch from 1944 on the right side of the lot is now partially buried beneath the driveway of the current buildings. There are now trees in the middle of the property. Only the section of the ditch that ran parallel to the waterway remains in open terrain.
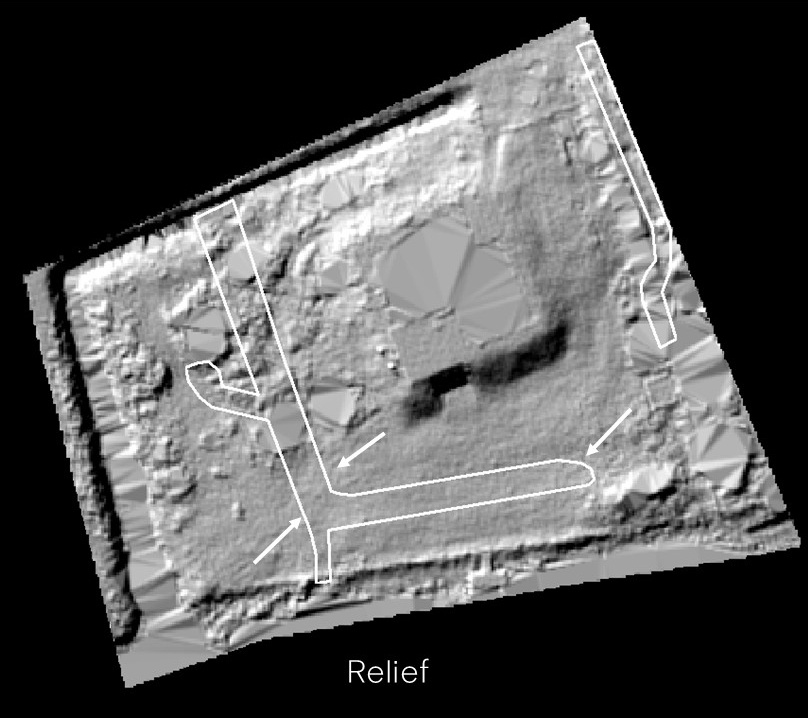
The first step is to create a cross-section. By drawing a line across the plot, a cross-section of the terrain is created. The cross-section does reveal minimal differences in elevation. The ditch that ran parallel to the watercourse (and thus perpendicular to the cross-section) is not clearly visible in the profile. Clearly visible are the depressions in the terrain that can be seen in the relief (Figure 11).
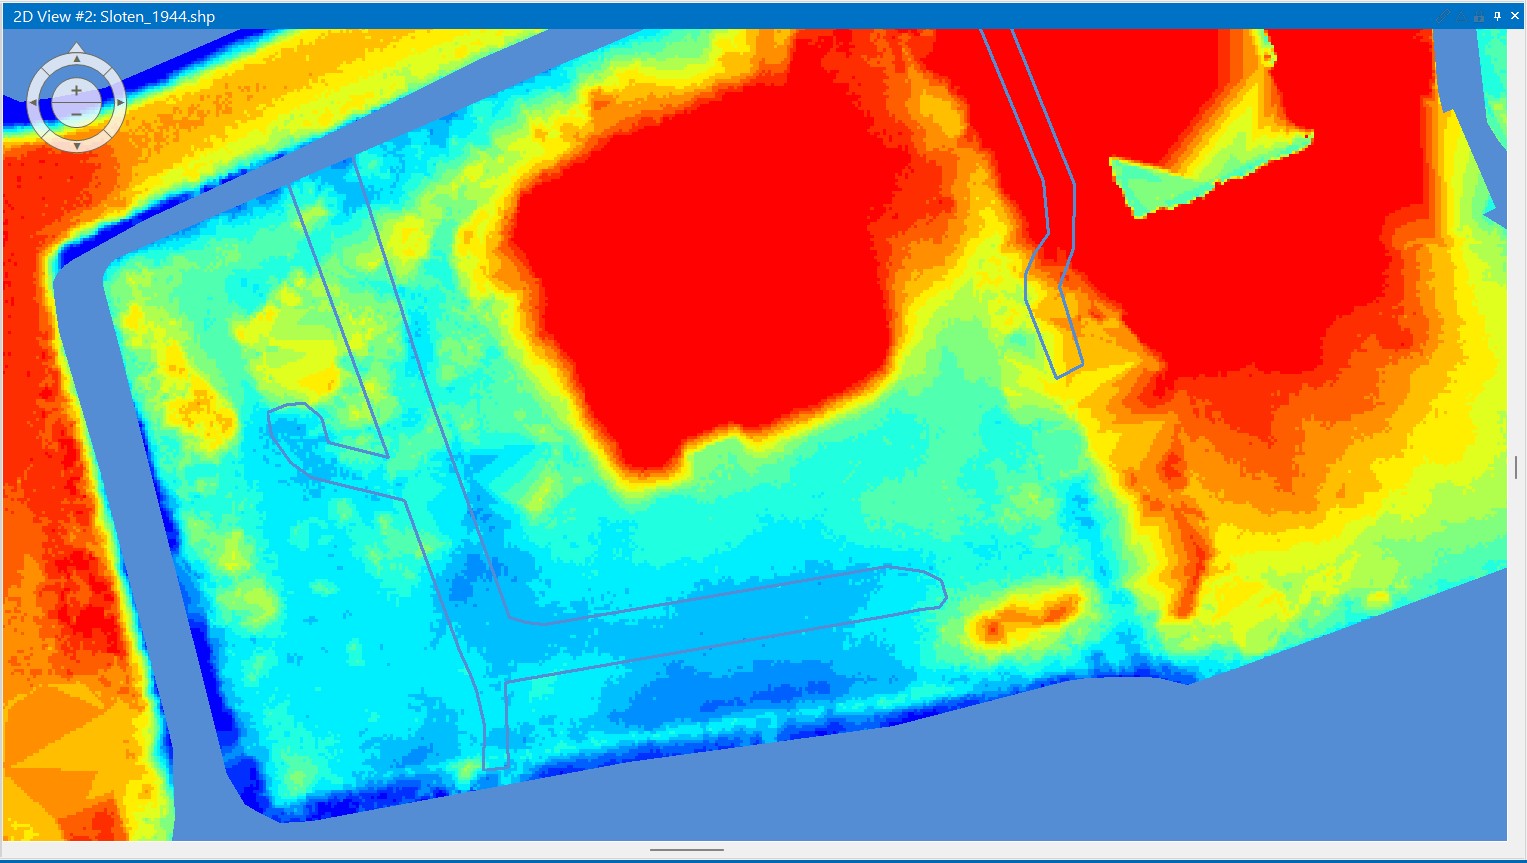
When we visualize this as a colored elevation map (Figure 12), we see a distinct depression (shown in blue) appear on the image. These correspond to the ditches from the years 1933–1945. This also explains the current damp spots on the property (the areas where water pools first), according to the resident.
Step 5: Deploying ground-penetrating radar
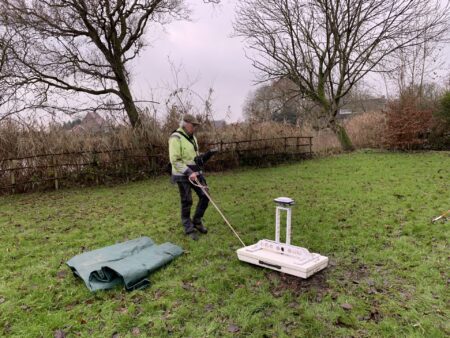
Now that we know for certain that there were indeed ditches on the site in 1945, we can focus our search on those specific areas. Together with Benedicte van der Roest of GT Eclipse BV, Harald is using ground-penetrating radar to analyze the old ditches.
A ground-penetrating radar transmits a signal. You may have seen this in the TV series *Crime Scene Investigation* (CSI). A ground-penetrating radar sends the signal into the ground. This signal reflects off “layers” in the soil. The reflected signal is captured, creating an image that allows us to distinguish the composition of the soil.
Unlike what you see on CSI, you don’t immediately see a “skeleton” appear on the radar screen. Because the ground-penetrating radar signal reacts differently to various materials, we can distinguish between sand, clay, stones, tree roots, and, for example, skeletons, which appear on the screen as “wavy” lines.
Step 6: Dig into the ground
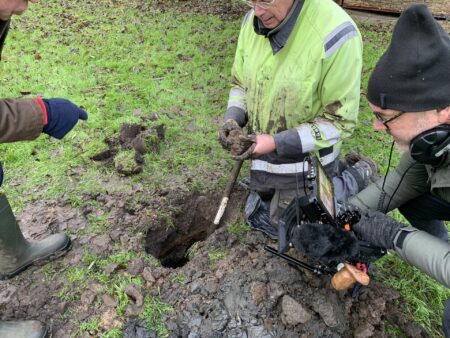
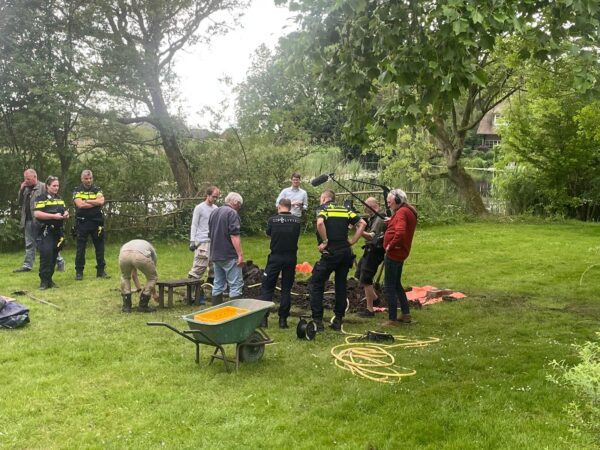
So what now? We dig into the ground to see what’s there and find some unusual material. Unfortunately, we have to wait for drier weather to continue digging, so we fill in the hole. In the summer of 2024, the time has finally come: we dig again and find bones. The police are notified and take over the excavation.
Has the mystery surrounding the old ditch been solved?
The bones appear to be animal skeletal remains, and we have not (yet) found the couple. It is believed that the site was once used as a burial ground for an illegal slaughterhouse. And since we have not yet been able to examine all areas, the investigation is still ongoing.
Thanks to Harald’s analysis using historical aerial photographs, modern datasets, and advanced technology, we were able to pinpoint the location of the old ditch on a recent map. This not only provides new insights for the research but also demonstrates the power of geodata to bring the past to life.
More information
Harald is a Business Consultant at IMAGEM. He bridges the gap between business, sales, and technology, and focuses on delivering value to the client. He collaborates with developers to create solutions for the public safety and security sector, educational institutions, and digital twins.
Would you like to learn more about this topic? Send Harald an email or send a message via our contact form.

Harald Görtz
Business Consultant
Remote Sensing Training
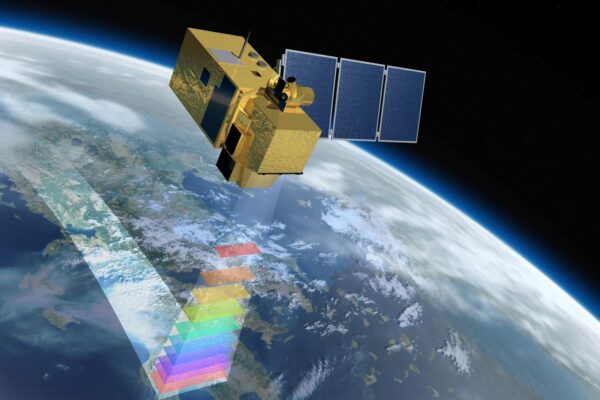
Want to know how you Remote Sensing apply Remote Sensing in your daily work? During our three-day training course, you’ll dive into the world of satellite imagery, drones, machine learning, and smart analytics. You’ll learn how to collect, process, and apply remote sensing for practical applications within your organization. From combining datasets to visualizing insights, by the end of this training you’ll know how to use remote sensing to improve decision-making.
Watch the documentary
Watch “Resistance,” the first episode of the three-part documentary “The War That Never Ends,” on NPO Start . Over the past five years, NOS reporter Lex Runderkamp has followed a number of people who delved into the archives in search of what happened during the war. This resulted in three extraordinary stories about resistance, betrayal, and persecution. Let yourself be swept away by this fascinating quest for hidden stories from World War II and the unique CABR archive.
Basic Register of Large-Scale Topography (BGT)
The BGT is a digital map of the Netherlands that clearly identifies buildings, roads, waterways, land parcels, and rail lines. The map is accurate to within 20 centimeters and includes many details that you would see in real life, such as trees, roads, and buildings. Here you will find information on topics including connections, products and services, feedback, quality assurance, and user consultations.
Current Elevation Database of the Netherlands (AHN)
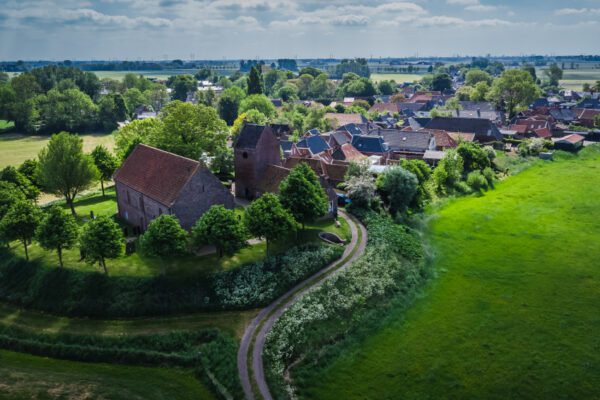
This is the digital elevation model for the entire Netherlands. It contains detailed and precise elevation data, with an average of eight elevation measurements per square meter. For example, archaeologists have used subtle elevation differences in meadows to identify ancient settlements that were invisible to the naked eye. This data is available to everyone free of charge and without restrictions. Both the raster data and the point clouds can be downloaded via PDOK and the National Georegister.