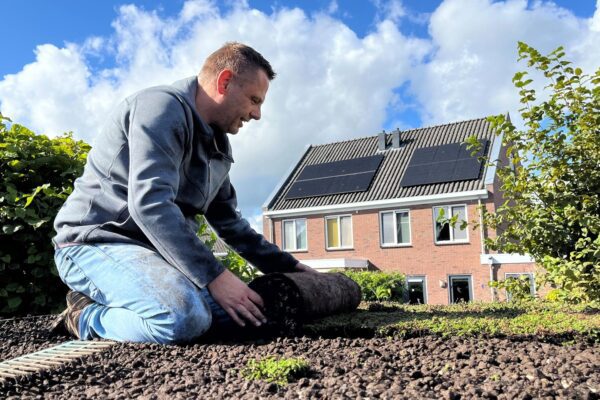

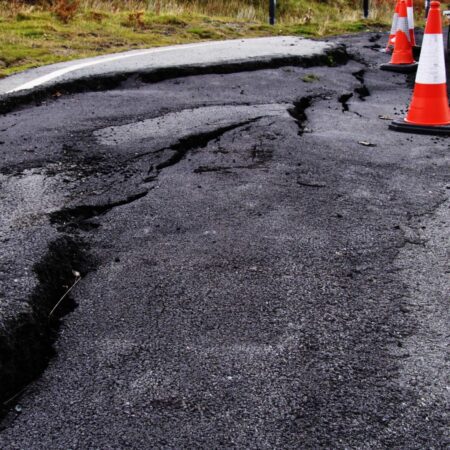
March 4, 2021 – Civil engineering structures (viaducts, portals, bridges, etc.) always deform slightly. This is taken into account in the design. However, regular monitoring is necessary to verify that the structure is behaving as intended in the design. Rijkswaterstaat (RWS) uses not only visual inspections but also deformation measurements for this purpose.
more about deformation measurement
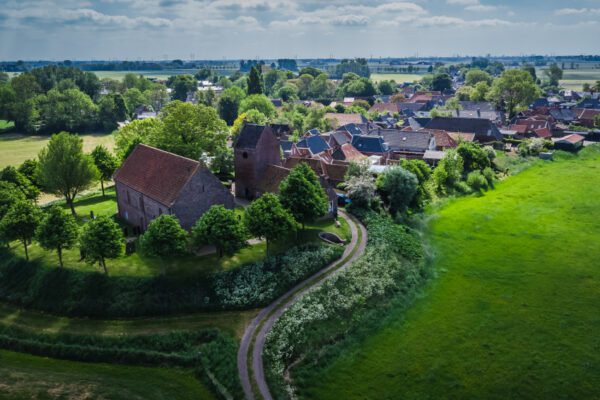
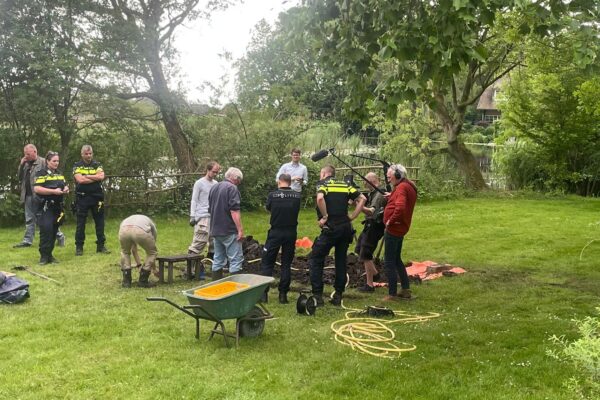
Land subsidence and settlement are common phenomena in large parts of the Netherlands, and Rijkswaterstaat has been monitoring the infrastructure for decades to identify unwanted settlement in a timely manner before damage occurs to roads or engineering structures. This is traditionally done by surveyors who measure the settlement of structures (fixed and movable bridges, viaducts, culverts, and tunnels) and then by specialist consultants who report on these findings.
Rijkswaterstaat has its hands full monitoring more than 6,000 structures. Approximately 1,200 of these are closely monitored for settlement. Other structures were built in the 1930s, 1940s, and 1950s without monitoring bolts. The absence of monitoring bolts makes traditional deformation monitoring impossible. If inspections reveal that deformations are occurring in these structures, a decision may be made to install monitoring bolts after all.
Traditional and modern measurement methods
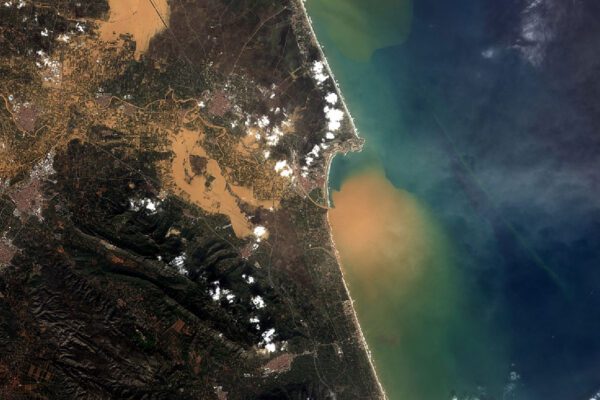
Rijkswaterstaat wants to have alternatives to field surveys available for several reasons. Safety, reduced disruption, and the annual measurement of more than 200 structures are costly undertakings. Satellites collect a large amount of data. We already use this data, for example, to monitor the NAP measurement network, infrastructure, and water quality. This gives us, as managers, a clear and up-to-date understanding of the condition of the area. Because we receive much more precise information about the current state of affairs, we can also plan more accurately. This has the potential to be enormously efficient; there will be less traffic disruption because we will have fewer roadblocks on highways, and it will reduce management and maintenance costs.
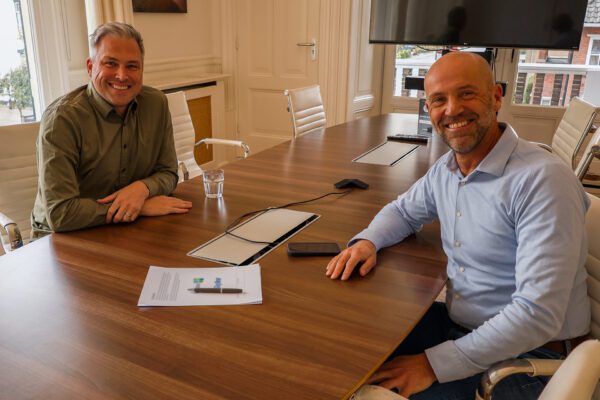
Sander Borghuis is a consultant for Technical Management & Maintenance at Rijkswaterstaat. He has a background in Physical Geography, GIS, and Remote Sensing, and has been collaborating with IMAGEM for some time. He decided to leverage the power of InSAR satellite measurements for asset monitoring and, together with IMAGEM , to further automate the monitoring process IMAGEM geospatial technology.
The solution allows you to monitor the speed and acceleration of subsidence on a local basis. Sander Borghuis, Rijkswaterstaat
From data automation to management information
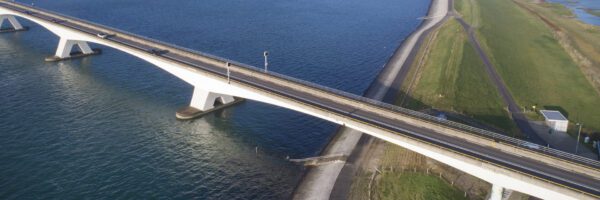
IMAGEM designed a customized solution based on Rheticus technology from Planetek Italia. A continuous monitoring system was created using Interferometric Synthetic Aperture Radar (InSAR) to identify objects and measure data. The Zeeburger Bridge near Amsterdam was chosen as a pilot site because it is large enough to distinguish the deck and abutments in the satellite images and to detect any deformations. In addition, a good set of traditional measurement data was available for comparison.
““We’re increasingly seeing this solution as a way to distinguish between locations where land subsidence is a problem and those where it isn’t. All you need as input are high-resolution satellite images. Although the accuracy isn’t on the same level as physically measuring the bolts, it does provide a quick (and continuous) overview of any changes. This is something we can use on a daily basis,” says Borghuis.
“Because InSAR provides a new measurement every week, an area can be monitored almost continuously, allowing us to closely track any deterioration or improvement. With the help of InSAR, we can identify trends that assist us in planning and budgeting for new detailed ground-based measurements.”
"Safeway"
Using InSAR data requires specialized technical expertise. Sander wanted to share the captured data and information with decision-makers and non-technical colleagues. An intuitive dashboard, Rheticus Safeway, was created to automatically analyze identified objects while minimizing the complexity of interferometric analysis.
The user interface simplifies access to radar data using filters and dashboards. Safeway provides a bird’s-eye view of the condition of their assets. While the InSAR measurement solution directly measures ground subsidence, the dashboard combines data from multiple sources with location and analytics to quickly provide an overview for decision-making. This helps Rijkswaterstaat prioritize sites.
“In this context, preference has been given to technology as a service (TaaS) or as actionable insights by reducing the need for technical expertise,” explains Patrick de Groot, sales director at IMAGEM. “This allows the technology to operate behind the scenes without burdening the user with technical details. Managers and policymakers can access valuable management information to support their decision-making.”
The way forward
The Rijkswaterstaat team expects to reduce the number of traditional measurements and to further automate the deformation monitoring process. This is expected to mean that a large portion of the physical measurements will no longer be necessary, unless the InSAR monitoring solution indicates otherwise.
“Rijkswaterstaat is transforming into an information-driven organization. We are constantly on the lookout for non-traditional sources of information and inspection data, such as drones and satellites. We would like to explore this together with the market.” According to Sander, this new method for deformation measurements aligns well with Rijkswaterstaat’s strategic direction.