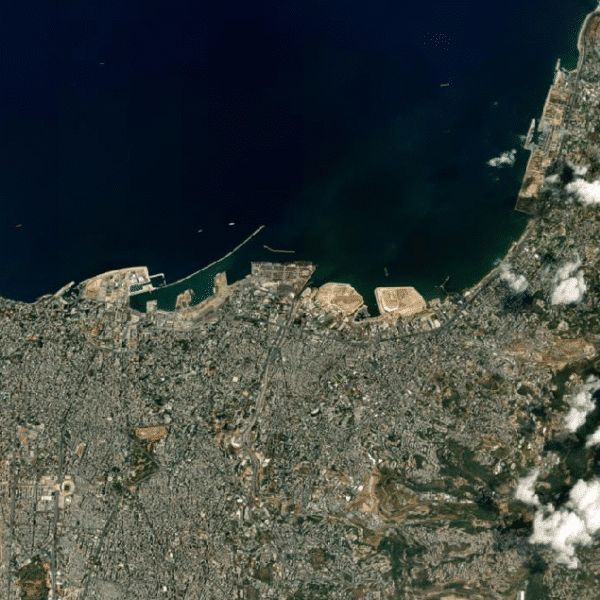

On the afternoon of August 4, 2020, a massive explosion occurred in the port of Beirut (Lebanon), resulting in numerous casualties and severe damage to the infrastructure. Just one day later, we saw the first crystal-clear “aerial photos” appear in the news. The port area was completely destroyed, and an overturned ship lay in the harbor.
These images come from WorldView-3, a satellite that captures images from an altitude of 617 km above the Earth’s surface with a maximum resolution of 30 cm. This means that each pixel in the image corresponds to an area of 30 by 30 cm in reality. Every day, WorldView-3 captures images of the Earth at a speed of 200 km every 12 seconds. The image of Beirut on August 5 was made available by Maxar as part of its open data program. The resolution of the image used is approximately 40 cm.
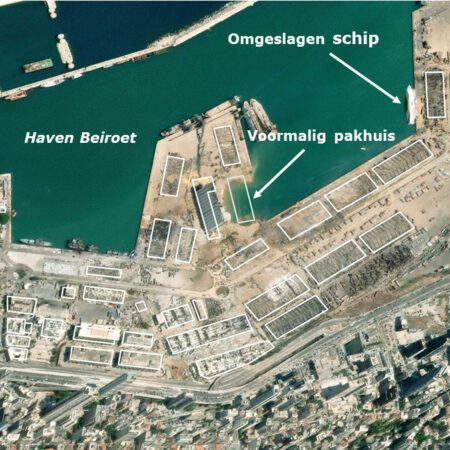
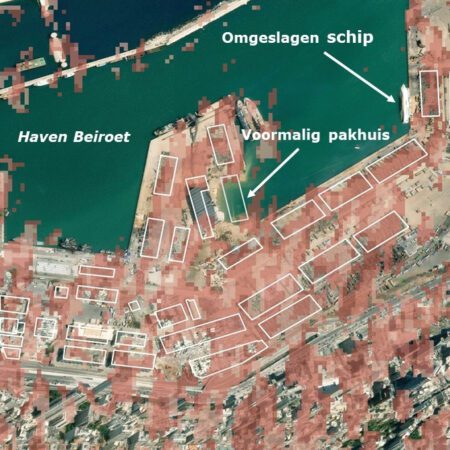
We can open this image in ERDAS IMAGINE®and combine it with other available geographic data, such as OpenStreetMap data. OpenStreetMap is a project dedicated to sharing freely available geographic data worldwide. By overlaying building data onto the WorldView-3 image (see below), we get a clear picture of the horrific consequences of the explosion. A crater with a diameter of approximately 135 meters has formed at the site of the warehouse. Further into the harbor, about 500 meters from the explosion, we see an overturned ship.
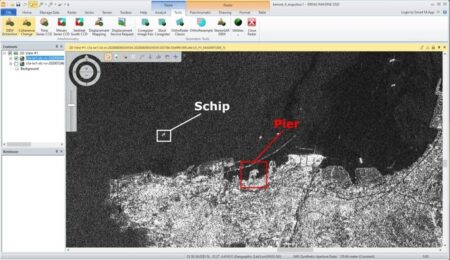
This is “only” the visible image; in the early morning of August 5, another satellite passed overhead: Sentinel-1A. The Sentinel-1A satellite was launched as part of the European Union’s Copernicus program. This satellite carries a Synthetic Aperture Radar (SAR) sensor that provides images under all lighting and weather conditions. SAR is a type of radar used, for example, to map the landscape or track ship movements.
When we view the Sentinel-1A radar image from August 5 in ERDAS IMAGINE®, we see a coarse black-and-white image appear; after all, the radar’s pixel resolution of 2.7 by 22 meters is lower than that of our previous Worldview 3 image. We can also see the crater near the pier where the explosion occurred.
However, in this case, we want to analyze the image using a computer rather than with our own eyes. With the SAR image, we can apply Coherent Change Detection (CCD). CCD is particularly well-suited for detecting changes occurring on the ground.
CCD combines two SAR images of the same location taken at different times and uses an algorithm to create a new image. This image highlights the differences between the two time points. Sentinel-1A has a revisit time of 12 days, meaning an image of the location is captured every 12 days. For Beirut, images from July 12 and 24 are available in addition to the one from August 5. Within ERDAS IMAGINE®, the E-Z Sentinel Coherence Change algorithm is available specifically for Sentinel-1. For a quick analysis, we used the radar image from July 24 as the reference image and compared it (CCD) with the images from July 12 and August 5. In the image below, we clearly see a dark spot around the port area in the coherence change between July 24 and August 5 (image 2) compared to the coherence change between July 12 and July 24 (image 1).
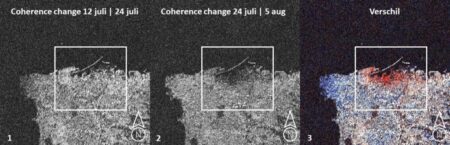
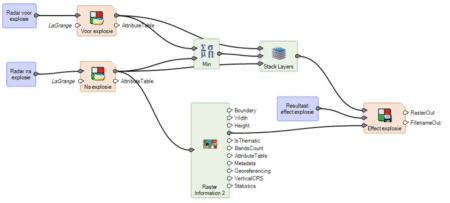
The difference between these two coherence images (Image 3, above) was then visualized using this model. These differences (the red hues) in the image represent changes in radar reflectivity caused by collapsed or damaged buildings and infrastructure; debris and dust also cause changes in radar coherence.
We can then classify that difference and combine it with the earlier image shown in Figure 2. The effects of the explosion are visible not only in the port area, but also in the districts surrounding the port.
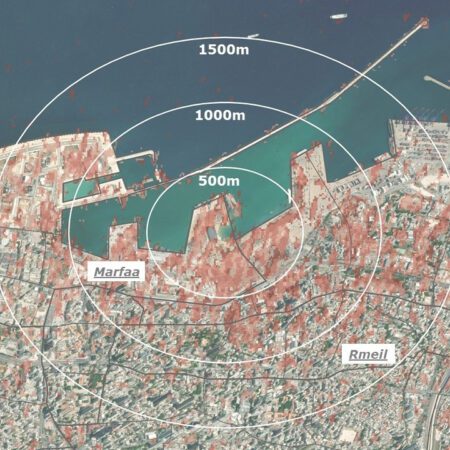
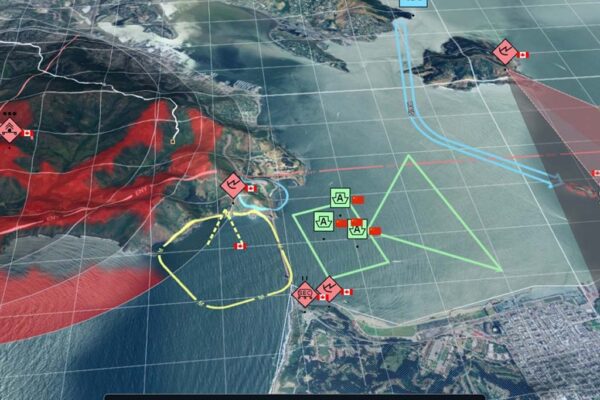
If we now zoom out further and overlay our image with distance rings, the affected area becomes clearly visible. The combination of various satellite images, geographic data, and techniques in ERDAS reveals the effects of the explosion—such as damage, debris, and dust—over a wide area. The districts of Marfaa, Medawat, and Rmeil are located in the hardest-hit area.
The world around us is constantly changing, and keeping track of those changes can be challenging and time-consuming. Satellite imagery can be used to identify changes or perform object detection, potentially even within your existing workflows. By incorporating change detection or object detection workflows based on machine learning algorithms, ERDAS can efficiently and effectively support your operations. Whether you want to keep your baseline records up to date or detect obstructions in waterways, our technology helps optimize your data automation.
More information
Harald is a Business Consultant at IMAGEM. He bridges the gap between business, sales, and technology, and focuses on delivering value to the client. He collaborates with developers to create solutions for the public safety and security sector, educational institutions, and digital twins.
Would you like to learn more about this topic? Send Harald an email or send a message via our contact form.

Harald Görtz
Business Consultant