
Magical? Absolutely! With a point cloud, we can help you experience the past. We can accurately map the present. They even let you glimpse into the future. In this blog, I’ll take you on a journey into the magical world of point clouds captured using LiDAR.
Here’s a quick technical note. LiDAR (Light Detection and Ranging or Laser Imaging Detection and Ranging) is a technology that determines the distance to an object or surface using laser pulses. A signal is transmitted and is received again a short time later via reflection. We call this collection of reflections a point cloud. It’s that simple. In other words, a three-dimensional representation of the terrain or object. The exact location (XYZ) of each point is known. You can see this clearly below. The monument on Dam Square, composed of countless points.
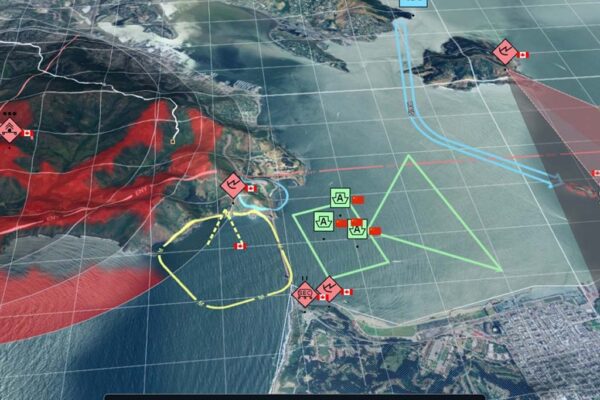
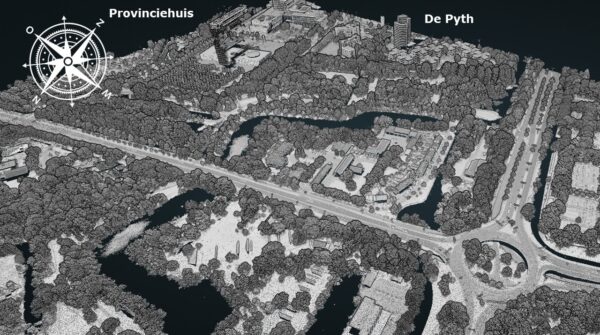
Getting Started with Open Data
In a previous blog post,“Don’t Dig Where the Old Ditch Used to Be,”I also used the Actueel Hoogtebestand Nederland (AHN). In short: the AHN is available as Open Data. This means that anyone can use the data for free and without restrictions. Both the raster data and the point clouds can be downloaded via PDOK and the National Georegister.
Point clouds are great datasets to work with. They provide a quick and easy way to visualize the world in 3D. Even the slightest variations in terrain elevation can be clearly visualized. It is precisely these elevation differences that allow us to bring the past to life.
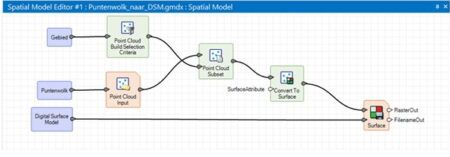
With ERDAS , we can easily create a Digital Terrain Model (DTM) from a point cloud. For this model, I specify the area of interest (using a shapefile). A DTM is then generated from that portion of the point cloud.
Disturbed soil
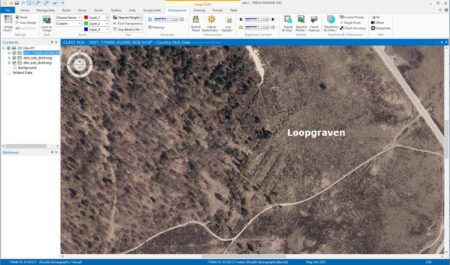
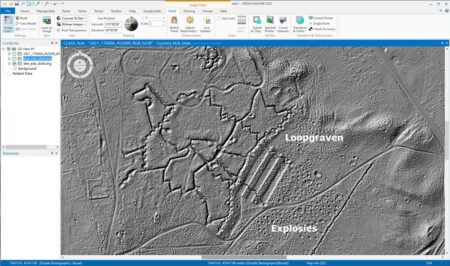
We’re heading to the Ginkelse Heide near Ede. When soil has been “turned over,” it often remains visible for quite some time. That’s a nice way of saying that the soil has been churned up. This happened frequently during World War II. The Ginkelse Heide near Ede clearly illustrates this. During World War I, trenches were dug there by the Dutch army. Then, during World War II, actual fighting took place there. You can already make out a few trenches in the aerial photo.
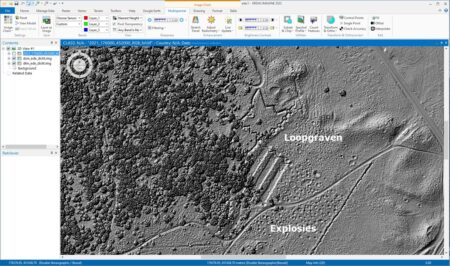
In the DTM I created from the point cloud, the trenches are clearly visible. The "craters" caused by explosions are also clearly visible. We didn't see those in the aerial photo. Unfortunately, there are also trees near the trenches. You can't see everything equally well. Or can you?
See the forest for the trees
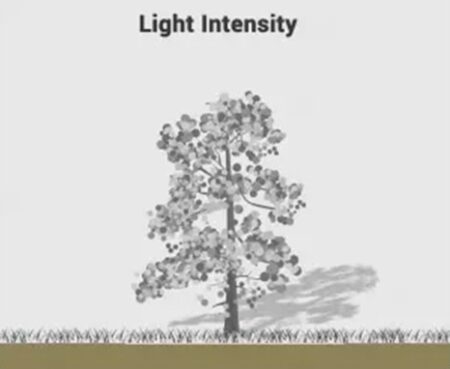
Did you know that LiDAR can also see beneath the trees? Imagine you’re walking through a forest. When you look up and see sunlight filtering through the canopy and reaching the ground, LiDAR can do that too.
A significant amount of light, just like sunlight, penetrates the canopy. By using LiDAR to obtain "ground points," you can actually see beneath the trees (source).
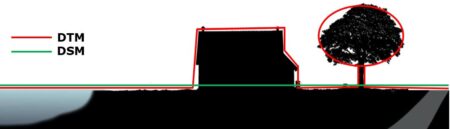
Let’s get technical again. A DTM consists of everything that LiDAR has detected: houses, trees, etc. (the red line). Instead of a DTM, we now want a Digital Surface Model (DSM). After all, we only want the ground. A DSM is everything minus the houses, trees, etc. We call this the ground level (the green line).
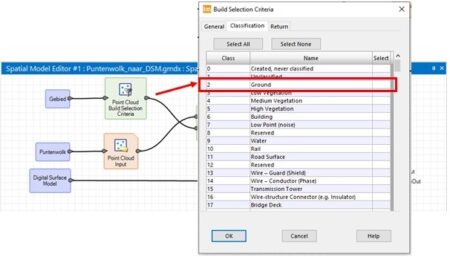
When we use our model now, we specify that we only want to include the ground points.
With a LiDAR file, we know what each point represents: ground, tall vegetation, or low vegetation. This is well-known. We fill in the gaps that appear in the point cloud—since we’re ignoring the trees—by interpolating the data. This way, I make the trees “disappear” from the point cloud.
We now see the same area, but without the trees. Instead of the small section of trenches we saw at first, an entire system of trenches and scars from explosions has now become visible in the forest. We’re simply looking down from above, beneath the trees.
That’s the magic of a point cloud. It lets you make the invisible visible.
We can also use LiDAR in yet another way to look into the past. Just as when taking a photograph, the intensity of a reflected pulse plays an important role.
This is because the strength of LiDAR returns varies depending on the composition of the surface object reflecting the return. These reflection percentages are referred to as LiDAR intensity. However, various factors influence the light intensity. For example, range, angle of incidence, beam, receiver, and surface composition (in particular) all affect the light intensity.
Light intensity is particularly useful for distinguishing features in land use/land cover. For example, impervious surfaces stand out in light-intensity images. This is why light intensity is well-suited for image classification, such as object-based image analysis (source).
So, using LiDAR intensity, we can essentially create a sort of black-and-white image of the area.
We have a few good examples of this as well. During the interwar period, the Dutch Air Force took a large number of aerial photographs. The photo below of Fort de Bilt dates from 1937 and comes from the collection of the Netherlands Institute for Military History.
These photos can be downloaded digitally from the Ministry of Defense’s image library. However, the photo was taken facing southeast, whereas maps are oriented toward the north. The beauty of a point cloud is that we can not only display it in black and white, but also rotate it in 3D to the desired viewing angle and direction.
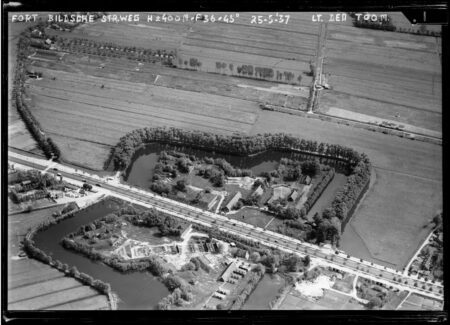

With an 84-year time gap, a point cloud from 2021, and an aerial photograph from 1937, we can compare the two situations. We position the point cloud in the same direction and at the same angle as the photograph.
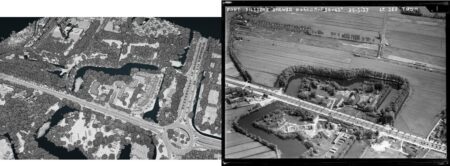
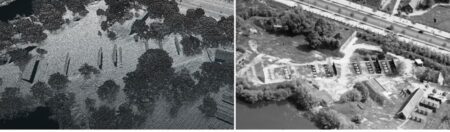
The original Fort de Bilt has retained its layout and a few of its original buildings. The area has been developed and densely built up, and Utrechtseweg has also changed considerably. The carbine shooting ranges (enlarged below) are still in place.
With an 84-year gap, we’ll leave the past behind and move on to Part 2: the present day!
More information
Harald is a Business Consultant at IMAGEM. He bridges the gap between business, sales, and technology, and focuses on delivering value to the client. He collaborates with developers to create solutions for the public safety and security sector, educational institutions, and digital twins.
Would you like to learn more about this topic? Send Harald an email or send a message via our contact form.

Harald Görtz
Business Consultant