What do wildfires, climate action, and 20 years have in common? Perhaps more than you might think at first glance. First, there are three other factors: heat, drought, and wind. These are the three key factors in the outbreak and spread of wildfires. They are also factors that we remote sensing monitor using remote sensing .
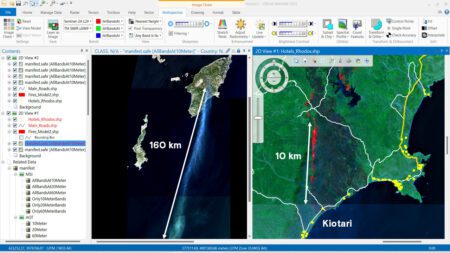
Take, for example, the wildfires in Greece, which have been all over the news recently. We saw the footage from the island. From space, we can see just how large the fires really are. Take Rhodes, for example, as we can see below. A plume of smoke stretching more than 160 kilometers across the Mediterranean Sea. Fires stretching over a distance of about 10 kilometers. Towns and hotels that need to be evacuated, with evacuation by sea because the roads are no longer passable or are insufficient for the task.
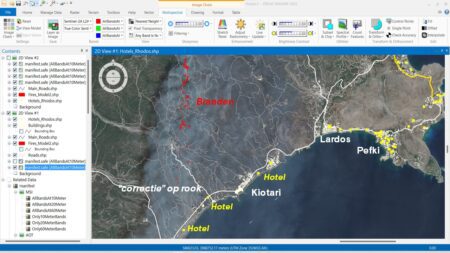
The following image (Figure 1) is a so-called multispectral image captured by the Sentinel-2 satellite. "Multispectral" means that the image contains more than just visible light. The part of the spectrum that we cannot see is also included in this image. Computers, however, can detect it; using Erdas , remote sensing , we can make it visible.
Seeing through the smoke
Infrared light, for example, can be used to identify active fire hotspots and burned areas. We can also perform radiometric correction on the image using Erdas . This correction reduces image distortion caused by factors such as gases and dust particles in the atmosphere. This allows us to see more clearly “through” the smoke. You can see this in the image below (Figure 2). Where are the fire hotspots? The dark area has already been burned. Which hotels and which roads are threatened or could end up in the danger zone? The damage on Rhodes is enormous; that much is clear. Let’s stay with the forest fires. The images I used were captured by Sentinel-2 satellites.
These satellites capture images of land areas across the globe. Together with the other Sentinel satellites, they form a fleet that collects data from all over the world. These images make it possible to quickly and easily access information from anywhere in the world. Incidentally, “Sentinel” means “guard.” The Sentinels use multispectral sensors, as well as radar, temperature, and spectrometric sensors for Earth, atmospheric, oceanic, and land monitoring. As guardians of the Earth, they are part of the European Commission’s Copernicus program for environmental monitoring.
Forest fires in Canada
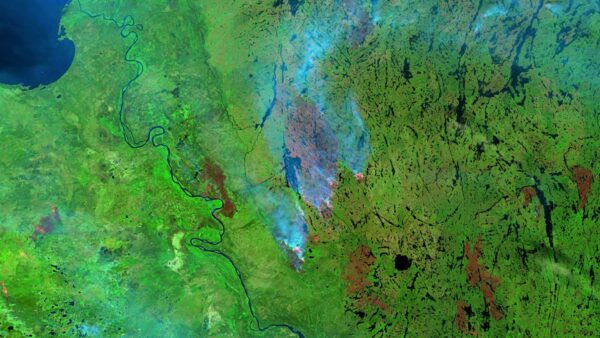
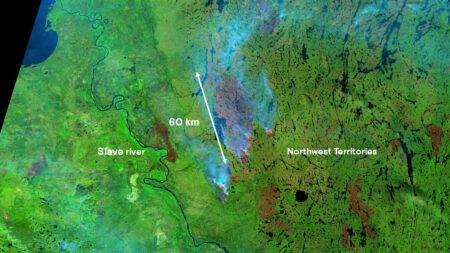
Let’s take a look further afield, specifically to Canada. Huge fires are raging in the vast forests and open areas. An area 2.5 times the size of the Netherlands has already burned there this year. On the right (Figure 3), you can see a SWIR (ShortWave Infrared) image of a few fires in the Northwest Territories. We use infrared because this wavelength is sensitive to differences in temperature and moisture. This is very useful for clearly identifying the fire sources and burned areas.
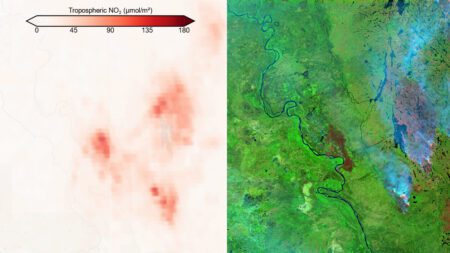
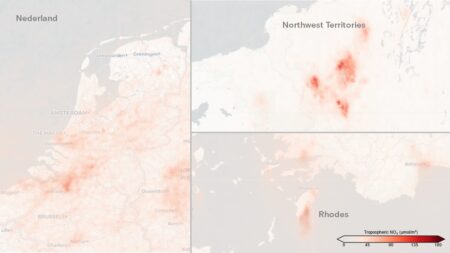
What else can we learn from a fire? With a spectrometric sensor, we can map the gases in the atmosphere. This is what the Sentinel-5P satellite does using the Tropomi sensor (TROPOspheric Monitoring Instrument). Among other things, it measures NOx, one of the gases released during combustion. On the left is the Tropomi image and on the right is the SWIR image of the area. In Erdas , we can easily combine these images to create the image below (Figure 4).
What if we didn't just focus on CO2 emissions? Emissions in Europe, led by the Netherlands, have fallen by 25 percent compared to 1990.
— Harald Gortz, Business Consultant at IMAGEM
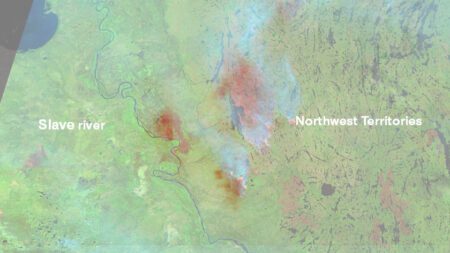
We observe elevated NOx levels precisely where the fires are occurring (Figure 5). When we now compare Rhodes, Canada, and the Netherlands (for reference) on the same scale, we get the following picture (Figure 6). It is clear that the fires in Canada generate much higher emissions than those in Rhodes. This makes sense, as the fires are larger and the biomass in Canadian forests is greater than the Mediterranean vegetation in Rhodes. By viewing the Netherlands on the same scale, we can get a better sense of the magnitude of these fires in Rhodes and Canada.
The Earth's lungs are burning
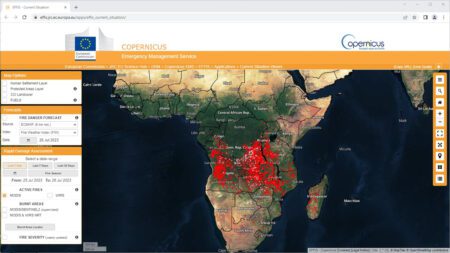
Moving on to satellites, the Copernicus program (Figure 7) uses data from sources such as MODIS (Moderate Resolution Imaging Spectroradiometer) to monitor wildfires around the world. On this webpage, you can see where fires are currently burning or have burned in the past, anywhere in the world.
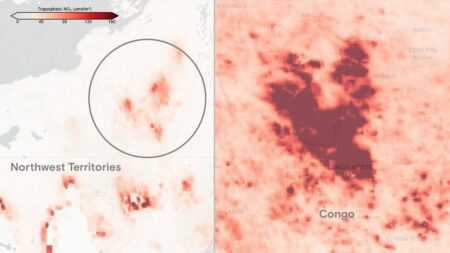
Central Africa—that’s a part of the world where things are really heating up right now! Let’s first look at the Sentinel-5P data on the fires in Central Africa; we’ll include the fires in Canada for comparison on the same scale (Figure 8). As you can see, the fires in Canada pale in comparison to those in Central Africa. It is estimated that half of the 750 million hectares that go up in flames worldwide each year are located in Africa (Belgian Earth Observation). Going back a few paragraphs: in Canada, an area 2.5 times the size of the Netherlands had already gone up in flames!
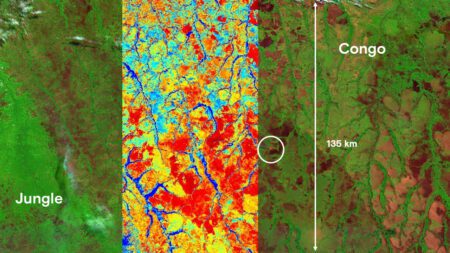
The image shown here (Figure 9) covers an area of 135 by 200 kilometers in Central Africa. It combines a SWIR image with a moisture stress analysis. I have overlaid the results of this stress analysis onto the SWIR image. What do you see in this image?
On the right, the effects of the fires and logging. Like green veins, the rivers run through the otherwise barren landscape. Circled, you can see a fire. In the center, moisture stress is depicted like a Mondrian painting. Red areas indicate severe moisture deficiency (the barren areas), while the blue areas show the regions surrounding the rivers. On the left, you can see a stretch of untouched jungle, a beautiful expanse of dense greenery.
This brings us to climate action, because aren’t the vast forests and jungles of Africa (and the Amazon) the lungs of the Earth? Isn’t it true that these very regions influence temperature and extreme weather? We know that these regions store CO2. And that they have a positive impact on local (continental) rainfall. These areas also have a positive effect on air currents by channeling hot air into the upper atmosphere. Not only that, but a large portion of the Earth’s oxygen is produced in these forests and jungles.
Focus on forests and jungles
What if we stopped focusing solely on CO2 emissions? Emissions in Europe—with the Netherlands leading the way—have fallen by 25 percent compared to 1990. However, as European emissions decline, we are also seeing an increase in emissions in other parts of the world. Worse still, we are also seeing a decline in forest and jungle areas during that same period.
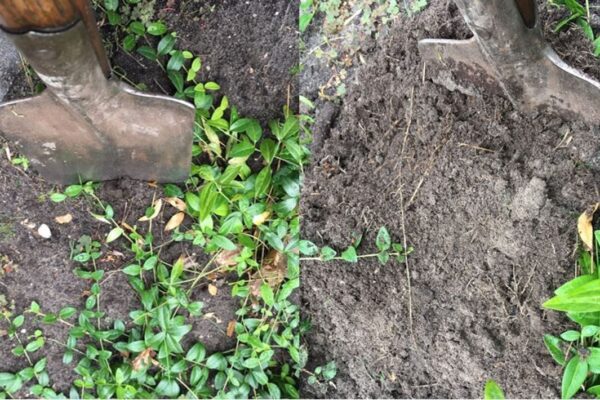
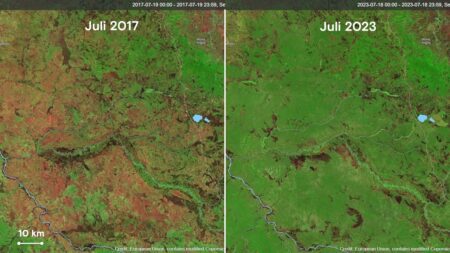
Every five days, the Sentinel-2 satellites capture images of Earth. Shown here are an image (Figure 10) from July 2017 (Sentinel-2B was launched in March of that year) and an image taken eight years later. Even though we see fires in the 2023 image, it is abundantly clear how the jungle and forests are able to recover. So it’s not all bad news; recovery is possible.
This has been studied by Wageningen University, and researchers are surprised by how quickly burned areas can recover. “After 20 years, burned forests on average reach nearly 80 percent of the soil fertility, soil carbon storage, structure, and tree diversity found in old-growth forests.”
Results over 20 years
Wouldn’t it make sense to redirect some of the billions of euros the Netherlands is currently spending on climate measures toward restoring rainforests? And to invest a few billion in those countries that are the biggest polluters right now? With the right climate measures, we could reduce forest fires within about 20 years. After all, restoring the forests should reduce heat, drought, and wind. Perhaps more countries should consider prioritizing the restoration of forests and jungles.
Not only that, but remote sensing also remote sensing us see heat waves, droughts, and flooding in the Netherlands—right in your own neighborhood. How? You can read all about it in my next blog post.
More information
Harald is a Business Consultant at IMAGEM. He bridges the gap between business, sales, and technology, and focuses on delivering value to the client. He collaborates with developers to create solutions for the public safety and security sector, educational institutions, and digital twins.
Would you like to learn more about this topic? Send Harald an email or send a message via our contact form.
Harald Görtz
Business Consultant