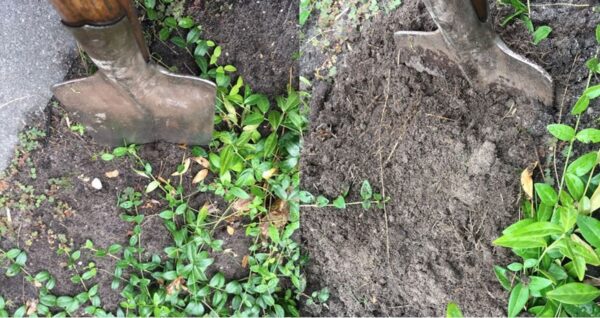

After a period of drought, we had heavy rainstorms, thunderstorms, and lots of puddles, and everything looks a lot fresher now. After one of those storms, I grabbed a shovel from the shed and dug into my garden. Dry soil! After all that rain? Was I surprised? No, unfortunately not…
Get started on your own
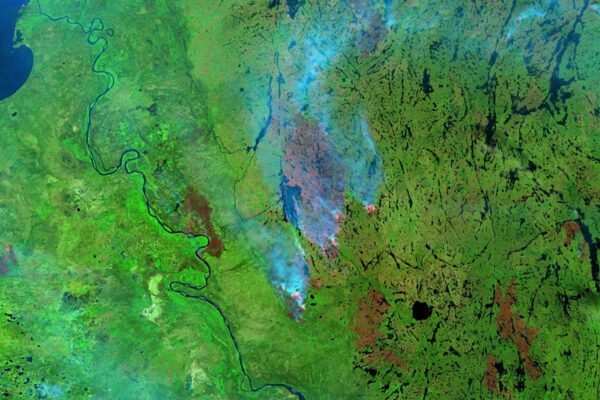
By using remote sensing applying this data in smart ways (and no, doing smart things isn’t hard), we can work together to turn challenges like drought, urban heat, and flooding into opportunities!
A heavenly data source
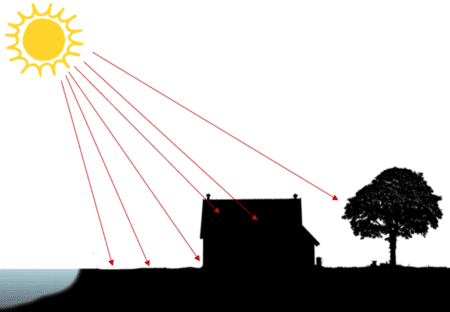
But let’s start with the data—back to those 150 million kilometers. That’s roughly the distance from Earth to the Sun. For years, the Sun has been providing us with a massive amount of data. Data that, when combined with other data, can help us turn challenges into opportunities! How? It’s quite simple: it’s all about sunlight.
First of all: the sun provides heat and light to the Earth through sunlight, or solar radiation. Solar radiation is the power per unit area received from the sun in the form of electromagnetic radiation. This solar radiation is measured in watts per square meter (W/m²) in SI units.
In short, the sun provides energy, which is converted into heat when sunlight hits an object. Alternatively, sunlight can be used to generate energy—specifically electricity—using solar panels.
Where do we get the data from?
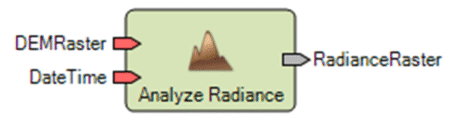
Of course, we’d like to know how much energy the sun can generate, and ERDAS has a handy tool for that: Analyze Radiance.
Based on the time and date, the operator calculates the output in irradiance units (watts per square meter) for each elevation pixel using the local slope and aspect ( the orientation of a building or other structure in a given direction).
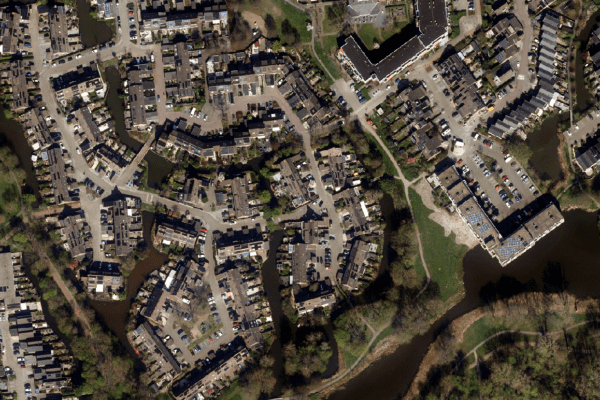
Are we there yet? No, because we still need a little more data. Specifically, where can that energy be generated? We’d like to do that on the roofs of houses. After all, that’s where the solar panels are installed. We can get that location from the BGT.
What about the shape of the roof? The slope and orientation? We’ll get that data from the AHN. While we’re at it, let’s also pull up a Landsat 8 image—we can use that to determine the temperature. That’s not entirely unimportant either.
The great thing about this data is that it’s all open data, accessible and usable by everyone.
The Large-Scale Topography Database (BGT) is a digital map of the Netherlands that clearly identifies buildings, roads, waterways, land parcels, and rail lines. The map is accurate to within 20 centimeters and includes many details that you would see in real life, such as trees, roads, and buildings. In short: the layout of the physical environment.
The Actueel Hoogtebestand Nederland (AHN) is the digital elevation map for the entire Netherlands. Source: AHN.
Landsat 8 is an Earth observation satellite that has been collecting data on Earth, including temperature data, since 2013. Source: USGS.
Solar panels and green roofs
In short, location, shape, temperature, and solar energy are all the data we need to determine where and how efficiently solar panels can be installed on roofs. It all started with data from 150 million kilometers away and a smart operator.
So how can we use that data to determine the solar energy potential? What factors do we need to take into account, and is it really that easy?
To determine solar energy based on solar radiation, we use the Analyze Radiance function. By combining this with AHN and BGT, we can calculate how much energy “falls” on a house’s roof at a given moment or throughout the day.
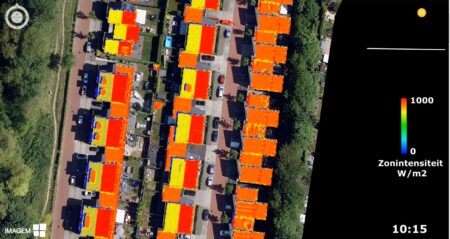
The example below shows the intensity of solar energy on July 15 at 10:15 a.m.
Of course, that’s just one of the many steps we need to take. For example, the intensity of solar energy varies from month to month. Ultimately, of course, the goal is to reduce CO2 emissions. In the case of solar poles, the goal is to determine where in the area the greatest savings can be achieved—at the lowest possible cost, of course. We also want to be able to distinguish between commercial buildings and residential homes.
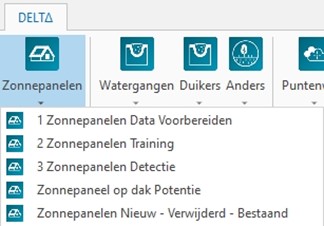
If we combine this data with data on solar panels, we can even calculate the investment and estimated yield for each individual roof. How do we do that efficiently? Simply through DELTA…
This is an additional toolset integrated into ERDAS . Whether it’s climate adaptation, drought, or building changes—to name just a few examples—you can get an answer with the click of a button! All you have to do is download the open data from a source like PDOK, and then you’re ready to get started.
DELTA offers more than just the “Roof Solar Panel Potential” feature. We’ve also included smart tools in DELTA to help you locate existing solar panels or “discover” new ones. Just use the open data in DELTA, and you’re all set!
And what do you do with the results? You can use them to inform policy—and you can do so effectively. How? With a dashboard. The results of the calculation from DELTA are exported as a shapefile, a format that can be used within any geoinformatics environment. It is a shapefile containing 44 characteristics for each building. For each building, we now know the number of panels to be installed, the potential investment, returns, and much more.
So what now? How do you make that data accessible? We’ll do that using a dashboard built with M.App Enterprise.
That, of course, is the big advantage. As a data scientist or geotechnician, working with the data and geo-software is no problem. The result also needs to be easy and straightforward to use in a given environment. A dashboard!
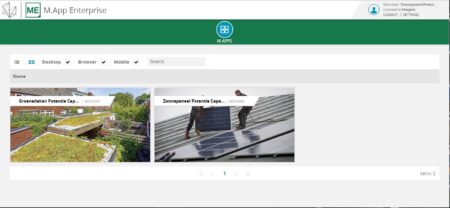
On the portal page within M.App Enterprise, we can see which apps are already available. In the example below, I have already added "Green Roof Potential" and "Solar Panel Potential."
Now, when you tap the app, it opens. At a glance, you can see where, how much, and what kind of investment is available, as well as the potential returns in a specific neighborhood or area.
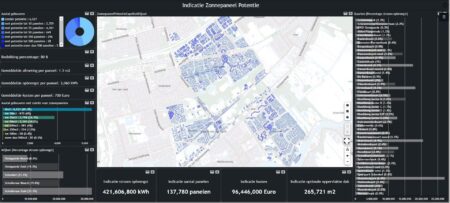
All widgets in the app are interactive. When you select a neighborhood, district, or a property with significant potential, the dashboard adjusts accordingly. If you click on a property, you’ll see a detailed screen showing the possibilities for that specific property. Whether it’s a municipality, town, neighborhood, district, or individual property, you can see its potential at a glance.
In summary, by using open data such as BGT and AHN in an Analyze Radiance algorithm, we gain insight into the potential for solar energy. We incorporate this into a model that also takes investment and returns into account.
Doing smart things isn't hard!
More information
Harald is a Business Consultant at IMAGEM. He bridges the gap between business, sales, and technology, and focuses on delivering value to the client. He collaborates with developers to create solutions for the public safety and security sector, educational institutions, and digital twins.
Would you like to learn more about this topic? Send Harald an email or send a message via our contact form.

Harald Görtz
Business Consultant