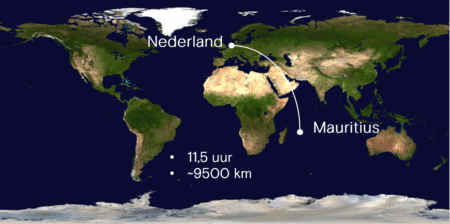
In the news reports, we see photos of the ship, oil leaking from it, and people cleaning up the oil, but where does all that oil end up? In the reports, we read and hear that about 1,000 tons of oil—that’s roughly 20 tanker trucks’ worth—has leaked. What does that mean? Since it’s about 9,500 kilometers away from us, we can’t just go take a look ourselves. But we can do that with the help of satellites.
Timeline
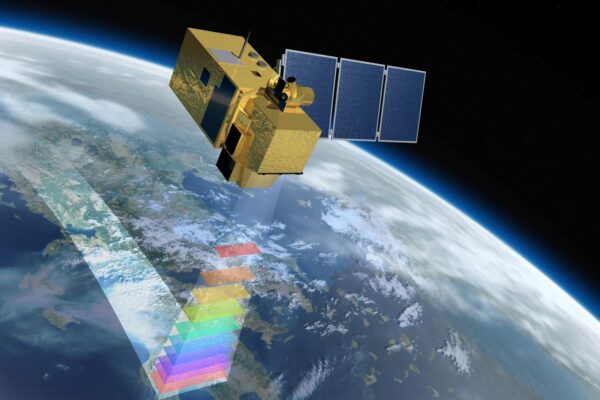
The Earth is monitored by satellites 24 hours a day; today, there are approximately 2,600 active satellites collecting data about the Earth. For remote sensing, we use data recorded by optical and radar satellites. This also applies to the beaches affected by the MV Wakashio; we can gain insight into the changes that occurred between July 25 and August 22. We can also see the consequences of the spill.
From July 25 to August 22, we can use optical imagery from Landsat 8, Sentinel-2, and WorldView-3; radar imagery is available from Sentinel-1. The figure on the right shows the events and imagery over time.

Visual inspection
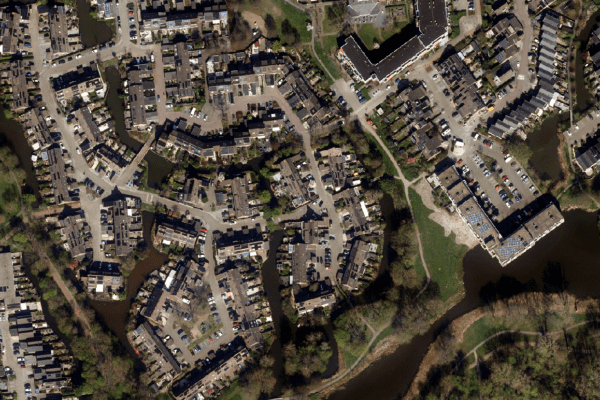
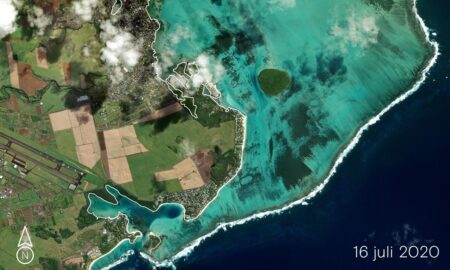
Let’s first take a look at the optical images from Landsat-8, Sentinel-2, and WorldView-3. On July 16, a week before the stranding, we can see—in the image from July 16 shown here—just how stunning the area looks. A beautiful blue sea, coral reefs, and lovely beaches.
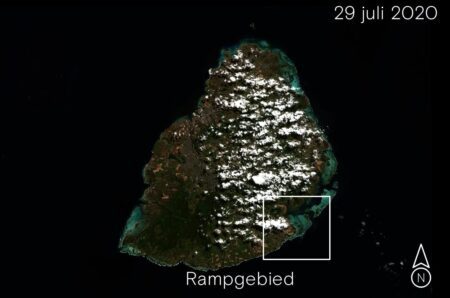
The Landsat-8 image, taken on July 29 after the ship ran aground, clearly shows the area and the MV Wakashio. Details are not visible to the naked eye.
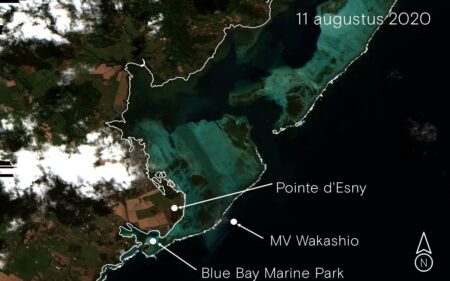
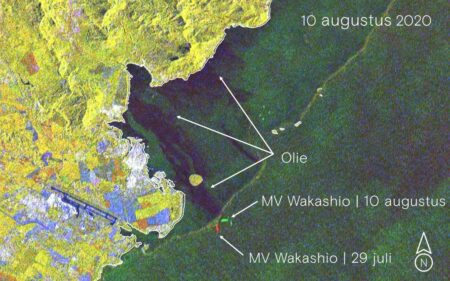
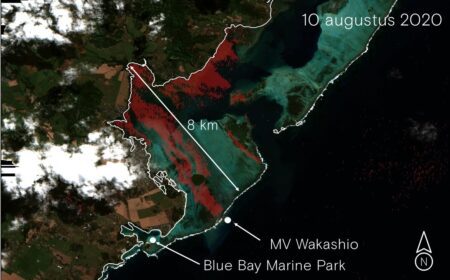
Next, in the Sentinel-2 image from August 11 shown here, we can see the MV Wakashio. We can also see oil slicks in the water, four days after the leak began.
Using radar
We are now interested in the leak and its impact on the area. To clearly visualize this, we are using radar images from Sentinel-1A and 1B in ERDAS These satellites utilize a Synthetic Aperture Radar (SAR) sensor, which provides images under all lighting and weather conditions. Synthetic Aperture Radar (SAR) is a type of radar used, for example, to map the landscape or track ship movements.
In the image, we see the Sentinel-1B image from August 10 in ERDAS ; in the radar image, the MV Wakashio is clearly visible as a bright white dot. The spilled oil is clearly recognizable as large black streaks in the water.
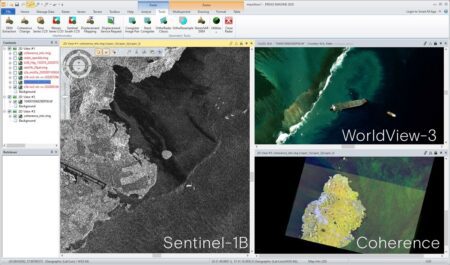
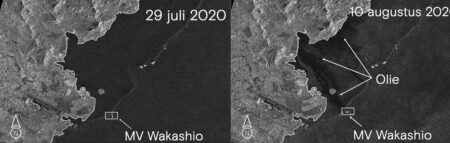
To get a clear picture of the impact of the spill, we’re also including the Sentinel-1 image from July 29. The MV Wakashio is clearly visible, but the oil spill is not, since the ship didn’t start leaking oil until August 6. This is our baseline image.
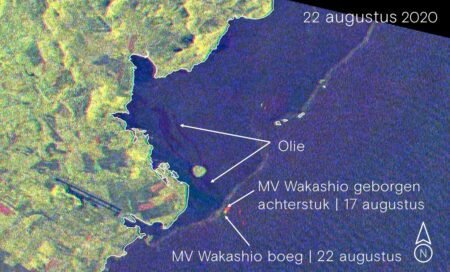
On August 17, the forward section of the ship was towed away, which is also evident in the updated radar image. The “dot” in the radar image—which represents the reflection of the MV Wakashio—has become “smaller.”
The four different Sentinel-1 radar images not only show that the ship ran aground but also that it moved after running aground. The images also show the results of the salvage operation. Indeed, the ship’s bow and hull sections were towed away on August 17.
The radar images are also capable of revealing oil slicks on the water—which makes perfect sense. Oil is denser than water and therefore reflects radar energy differently than water does. This appears as dark patches on the water in the satellite image.
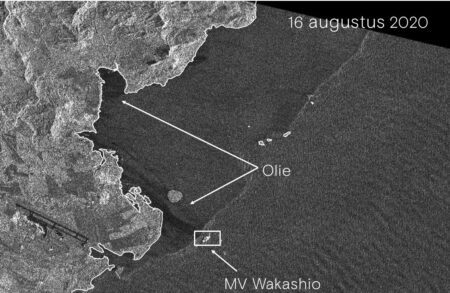
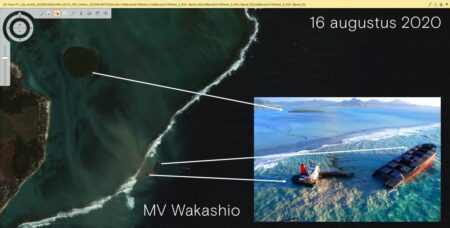
The footage from August 16 and 22 shows two significant events involving the MV Wakashio near the beaches. Specifically, these are the breaking up of the ship and the salvage of the bow and midship sections, respectively. The images below show close-ups of these scenes.
Analyzing radar images
When we look at the optical and radar images, we see that there was a lot of activity around the MV Wakashio between July 25 and August 22. We can get a clearer picture of this by analyzing the radar images.
We will now begin by applying Coherent Change Detection (CCD) to the images from July 29 and August 10. CCD is particularly well-suited for detecting changes occurring on the ground.
In the image shown here, we see the Sentinel-1B image from August 10 in ERDAS In the radar image, the MV Wakashio is clearly visible as a bright white dot. The spilled oil is clearly recognizable as large black streaks in the water.
CCD combines two SAR images of the same location taken at different times and uses an algorithm to create a new image. This image highlights the differences between the two time points.
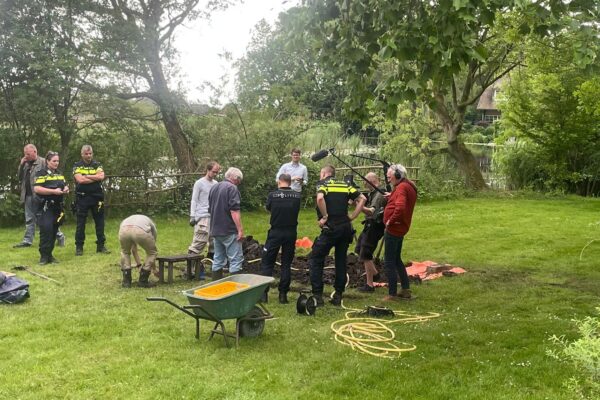
On August 15, the ship broke apart; the bow and hold sections broke off in front of the wheelhouse. This is visible in the Sentinel-2 image from August 16, and images from Mobilisation Nationale Wakashio also show this; see the image on the right.
The image shows the differences between the two time points, specifically the change in the backscatter characteristics of the radar image. Specifically, we can see confirmation of the oil trails on August 10. We also see the MV Wakashio as a red spot, position on July 29, and a green spot, position on August 10, in the image. A quick measurement shows that the ship has moved a distance of 500 meters. To easily remember changes when analyzing radar images: “red has fled,” meaning red has disappeared.
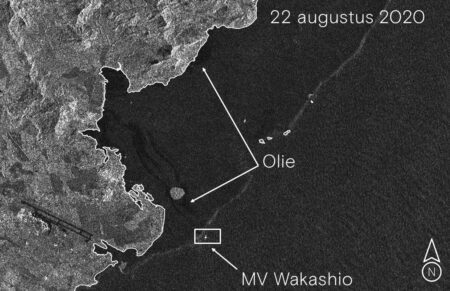
This break is also clearly visible on the radar image from August 16. We will perform a CCD analysis of this image together with the radar image from August 22 (i.e., after the largest broken-off section was recovered).
The oil is clearly visible, though much less so than in the previous analysis. Also visible as a large red patch is the broken-off bow section of the ship, which had been recovered at that time. The CCD clearly shows the changes in the surroundings, both around the ship and the oil trails in the water, which we can visually confirm in the image from August 22.
Where did the oil go?
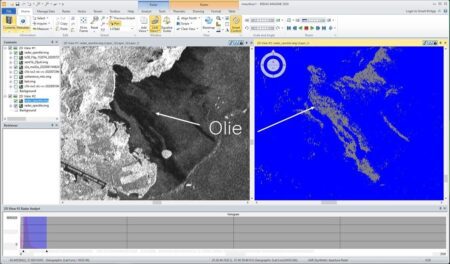
Now we want to remove the oil from the radar image to make it clearly visible; after all, we want to know how large the affected area is, how long the coastline is, and where the oil is washing ashore. In ERDAS , we first use Radar Speckle Suppression to “filter” noise out of the radar image. The principle of radar is that it captures the emitted energy that is reflected back from the Earth’s surface to form an image. This image also contains noise—energy that is not reflected directly from the object, but rather at an angle, for example. We filter out this noise, known as speckle, to clearly distinguish between the water and the oil on the water.
On this “despeckled” image, we now switch the display to “Level slice,” which allows us to distinguish between light and dark areas (oil, denser matter) in the histogram, which shows the energy distribution of the radar image. This is because the reflection from oil-on-water differs from the reflection of water alone in our radar image. In Figure 15 above, the left side shows the filtered radar image, while the right side displays the oil-on-water in gray. In this way, we can extract the “oil” from the radar image and then overlay it onto the optical image. This allows us to see very clearly where the oil is located in the area.
There's the oil!
The image from August 10, shown here, clearly shows the oil from the MV Wakashio in the area.
Six days later, on August 16, we see a clear decrease in the amount of oil on the water. Most of the oil has already leaked from the ship and washed ashore.
By the way, we can ignore the red line at the top right of the image; this is the edge of the radar image. These edges are displayed as dark lines but do not represent reflections from objects.
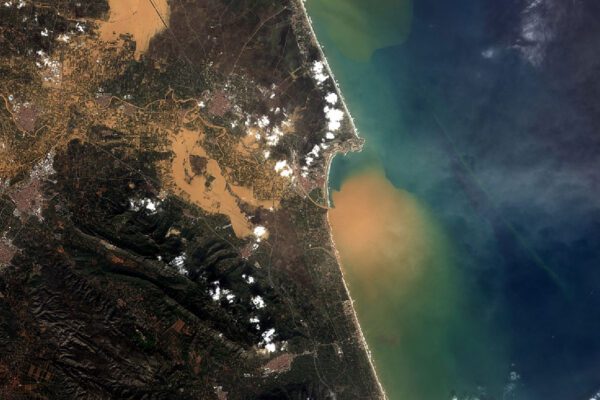
Next, on August 22, we see that not all of the oil has washed ashore yet. However, we do see that, since the spill began, the spread of the oil has remained confined to the same area.
In summary, satellite imagery shows that between July 25 and August 22, the MV Wakashio did not remain stationary and broke in half. Most of the oil has spread across the area and washed ashore. We can measure this area and the associated coastline.
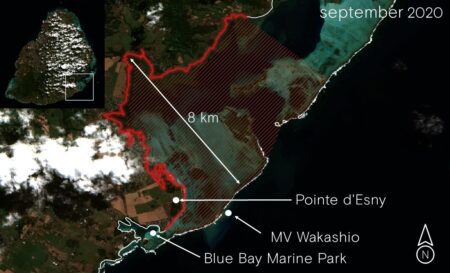
As a result, oil can be found along the coastline over a distance of at least about 35 km. In terms of area, this covers approximately80 km², an area roughly the size of the city of Groningen. The latest image from September provides a general overview of this.
The National Crisis Committee of Mauritius has stated that, although the disaster appears severe, it affects only a small area of Mauritius. To date, 1,122 tons of liquid waste and 792 tons of solid waste have been removed from the area. A swift response, knowing the location of the waste, and mobilizing all available resources ensured that the damage was limited. We can count ourselves lucky that it was only a bulk carrier that ran aground. An average oil tanker carries about 25,000–80,000 tons of oil, which is 25 to 80 times as much as the MV Wakashio leaked.
More information
Harald is a Business Consultant at IMAGEM. He bridges the gap between business, sales, and technology, and focuses on delivering value to the client. He collaborates with developers to create solutions for the public safety and security sector, educational institutions, and digital twins.
Would you like to learn more about this topic? Send Harald an email or send a message via our contact form.

Harald Görtz
Business Consultant