
August 26, 2021 – Over the course of 70 years, plastic has gone from a global invention to a global problem. A problem as big as 950 million elephants! How is that possible? Plastic production took off in the 1950s, and since then we have manufactured approximately 8.3 billion tons of plastic. More than 6.3 billion tons of that is waste. 5.7 billion tons of that is gone, and we don’t know where it has gone.
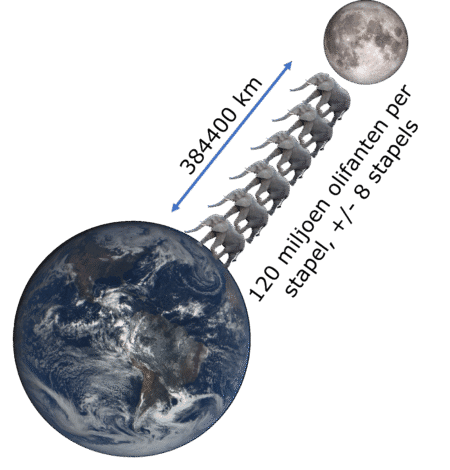
To the moon
That’s an incredible amount of waste we’ve generated. It’s so much that we could cover the entire land area of the Earth’s surface (144.5 millionkm²) with a layer of plastic waste. Back to the elephants. An African elephant weighs an average of 6,000 kg, so 5.7 billion tons is equivalent to 950 million elephants (source: National Geographic). An African elephant is on average 3.2 meters tall, so with 950 million elephants, we could stack them nearly 8 times high, from Earth to the Moon. In 70 years, we have generated the equivalent of 950 million elephants’ worth of plastic waste. Where has it gone?
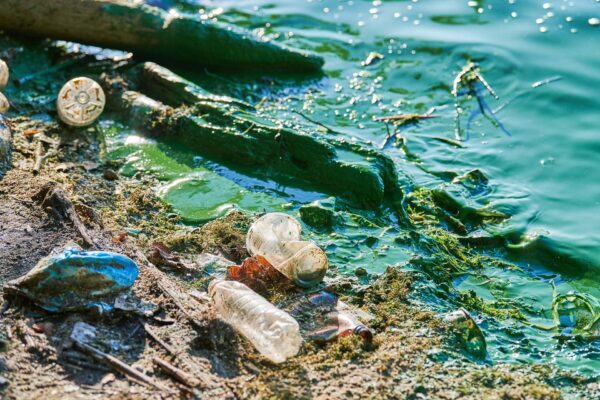
We know that the oceans are the world’s dumping ground. We regularly read about marine animals that have become entangled in plastic waste or have died with plastic in their stomachs. However, we don’t know exactly how much plastic ends up in the ocean. The plastic that enters the ocean forms what is known as “plastic soup,” and over time, parts of it sink to the bottom or wash back ashore.
Would it be possible to use remote sensing to locate those 950 million pieces of plastic in the ocean? Unfortunately, the answer to that question is both yes and no. It remains an incredible amount of waste, but it has managed to hide itself very well on our planet.
No recordings
As of this writing, there are more than 2,787 satellites in orbit around Earth. About 426 of these satellites are used for Earth observation, of which approximately 27% are used for environmental monitoring. The very term “Earth observation” encapsulates our challenge. Put simply, we do not monitor the ocean within the electromagnetic spectrum.
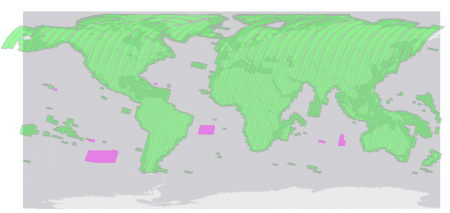
Figure 2, which shows Earth monitoring by Sentinel-2, illustrates this clearly. No images are taken over the oceans, which cover about 71% of the Earth’s surface. That saves a lot of data—data we initially thought we didn’t need.
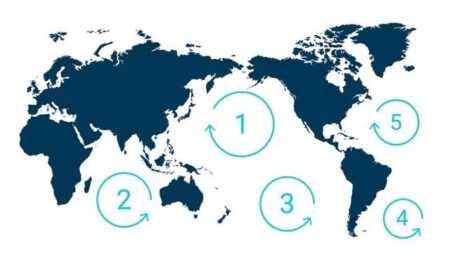
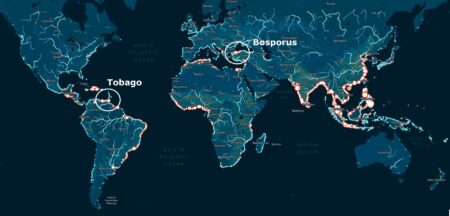
A map from The Ocean Cleanupclearly illustrates the challenge: the various “plastic garbage belts” around the world form precisely where cold and warm ocean currents meet.
So these are exactly the areas that our environmental observation satellites don’t capture. Can’t we find that plastic, then? Not yet, at least not in the middle of the oceans.
Data set
Along the coast, particularly where rivers flow into the sea, we can find plastic in the water. The article *Finding Plastic Patches in Coastal Waters using Optical Satellite Data* by Lauren Biermann, Daniel Clewley, Victor Martinez-Vicente, and Konstantinos Topouzelis explains how this happens. They use Sentinel-2 data to detect plastic in spectral profiles.
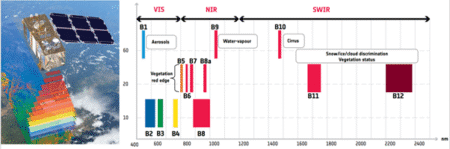
Like a giant vacuum cleaner, the Sentinel-2 satellite collects data across 13 different bands of the electromagnetic spectrum as it flies overhead at an altitude of 786 km. The image it captures covers an area of 110 by 110 km—a veritable treasure trove of data.
The data from the various bands, as shown in Figure 4, tell us a great deal about the area being imaged. Sentinel-2’s 13 spectral bands—ranging from the visible and near-infrared to the short-wave infrared—at various spatial resolutions, ranging from 10 to 60 meters on the ground, are used to detect plastic in the water.
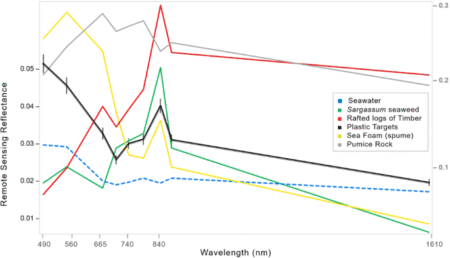
When sunlight hits an object, some of the light is reflected back, which we humans perceive as different colors. A satellite can see much more; one of the topics in the article shows what the spectral profile of “debris” in the ocean looks like
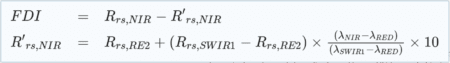
To detect this debris, the research team developed the Floating Debris Index (FDI). An index in remote sensing be explained as follows:
An index is a single number that quantifies, for example, vegetation biomass and/or plant growth for each pixel in a remote sensing image. The index is calculated using various spectral bands that are sensitive to plant biomass and growth.
The FDI calculation is determined based on the spectral profile of “marine debris.”
Coastal regions
By then calculating the Normalized Difference Vegetation Index (NDVI) for the same area (the index for living plants) and subtracting one from the other, plastic waste in the ocean can be detected. Note that this is a rough approximation; for a more accurate determination, atmospherically corrected images are used and an analysis step based on machine learning is applied. For now, I am only using the FDI minus the NDVI. The Ocean Cleanup also has a nice map on their site showing the discharge in tons of plastic per river.
For this blog, I chose two random examples: Tobago and the Bosporus. Not entirely at random, of course—the fact that there is plastic pollution there and that clear images from the Sentinel-2 program were recently made available did influence my choice.
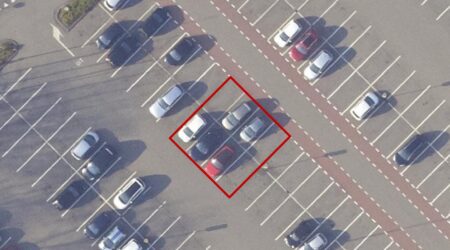
Sentinel-2 images have a fairly coarse resolution; each pixel represents an area of 10×10 meters. To detect plastic waste within a single pixel, plastic must cover approximately 60% of that area. The image below illustrates this: 1 pixel of a Sentinel-2 image from which the FDI can be calculated is best compared to 8 parking spaces with at least 5 cars parked in them.
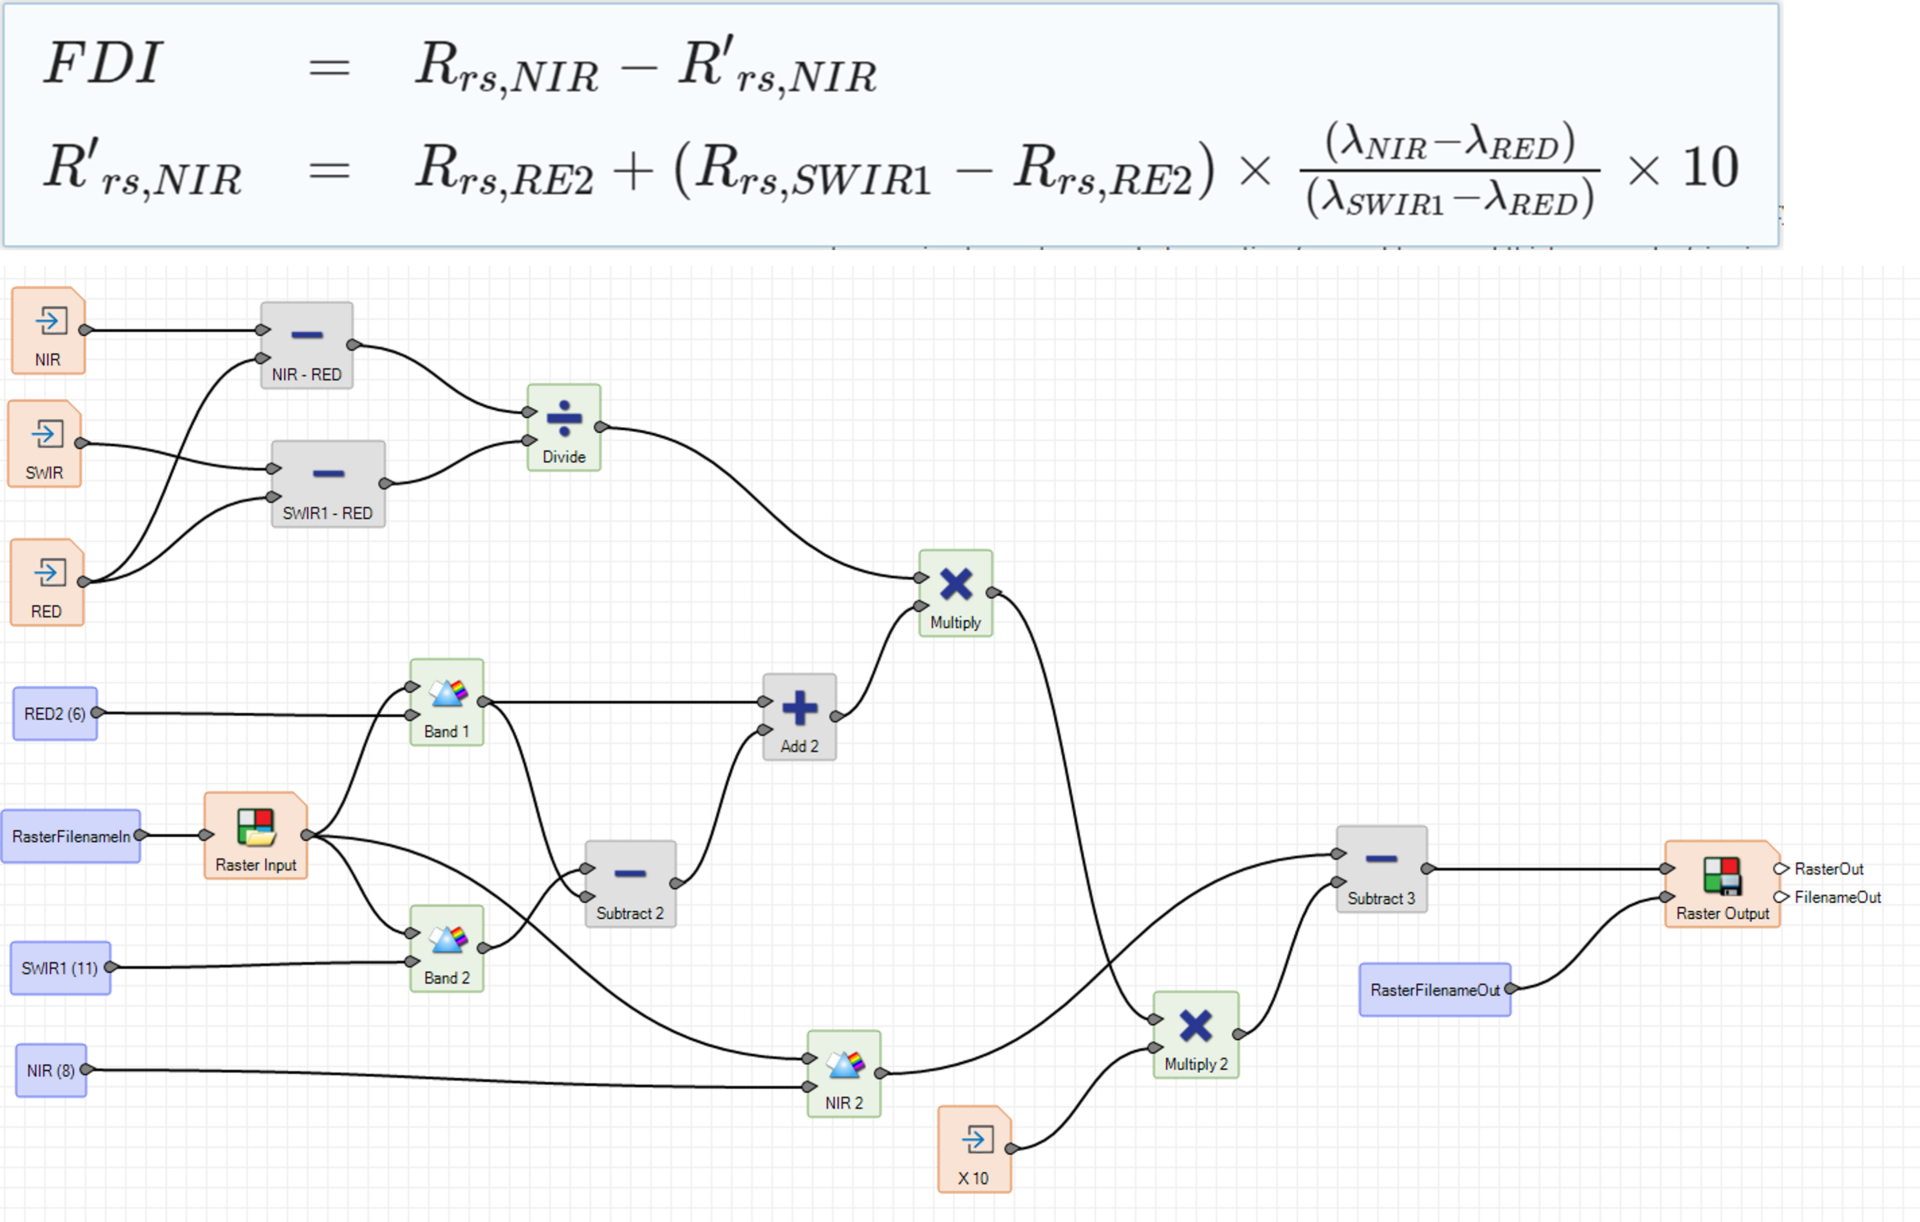
Sentinel 2 imagery is supported in ERDAS ; NDVI is a standard feature, and the FDI formula can be “configured” within the Spatial Modeler in ERDAS , as shown below.
Spotting plastic
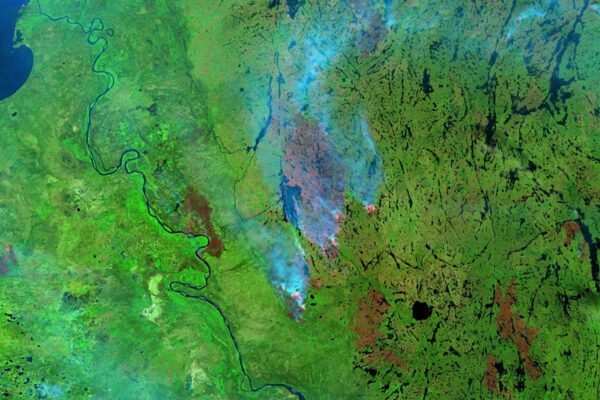
We’re ready to get started. The first image is a shot of the sea off San Fernando in Trinidad and Tobago. The Caribbean is notorious for its enormous per capita waste output. Trinidad and Tobago has the dubious distinction of leading the way in this regard.
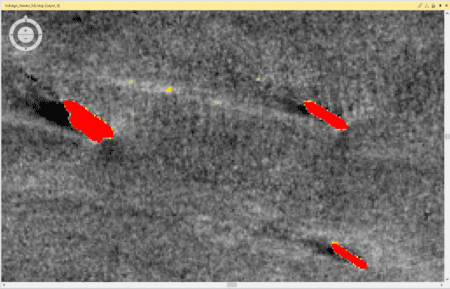
In the satellite image itself, we see the beautiful blue Caribbean Sea. When applying the FDI, the boats heading toward the harbor become clearly visible. This makes sense, since they are not vegetation and are large enough to consist of multiple pixels. However, their value is too high (they appear red in the image with the selected visualization). However, between the boats, various light-colored pixels are visible. These are large concentrations of “debris” within the 10×10-meter squares, which in turn consist largely of plastics.
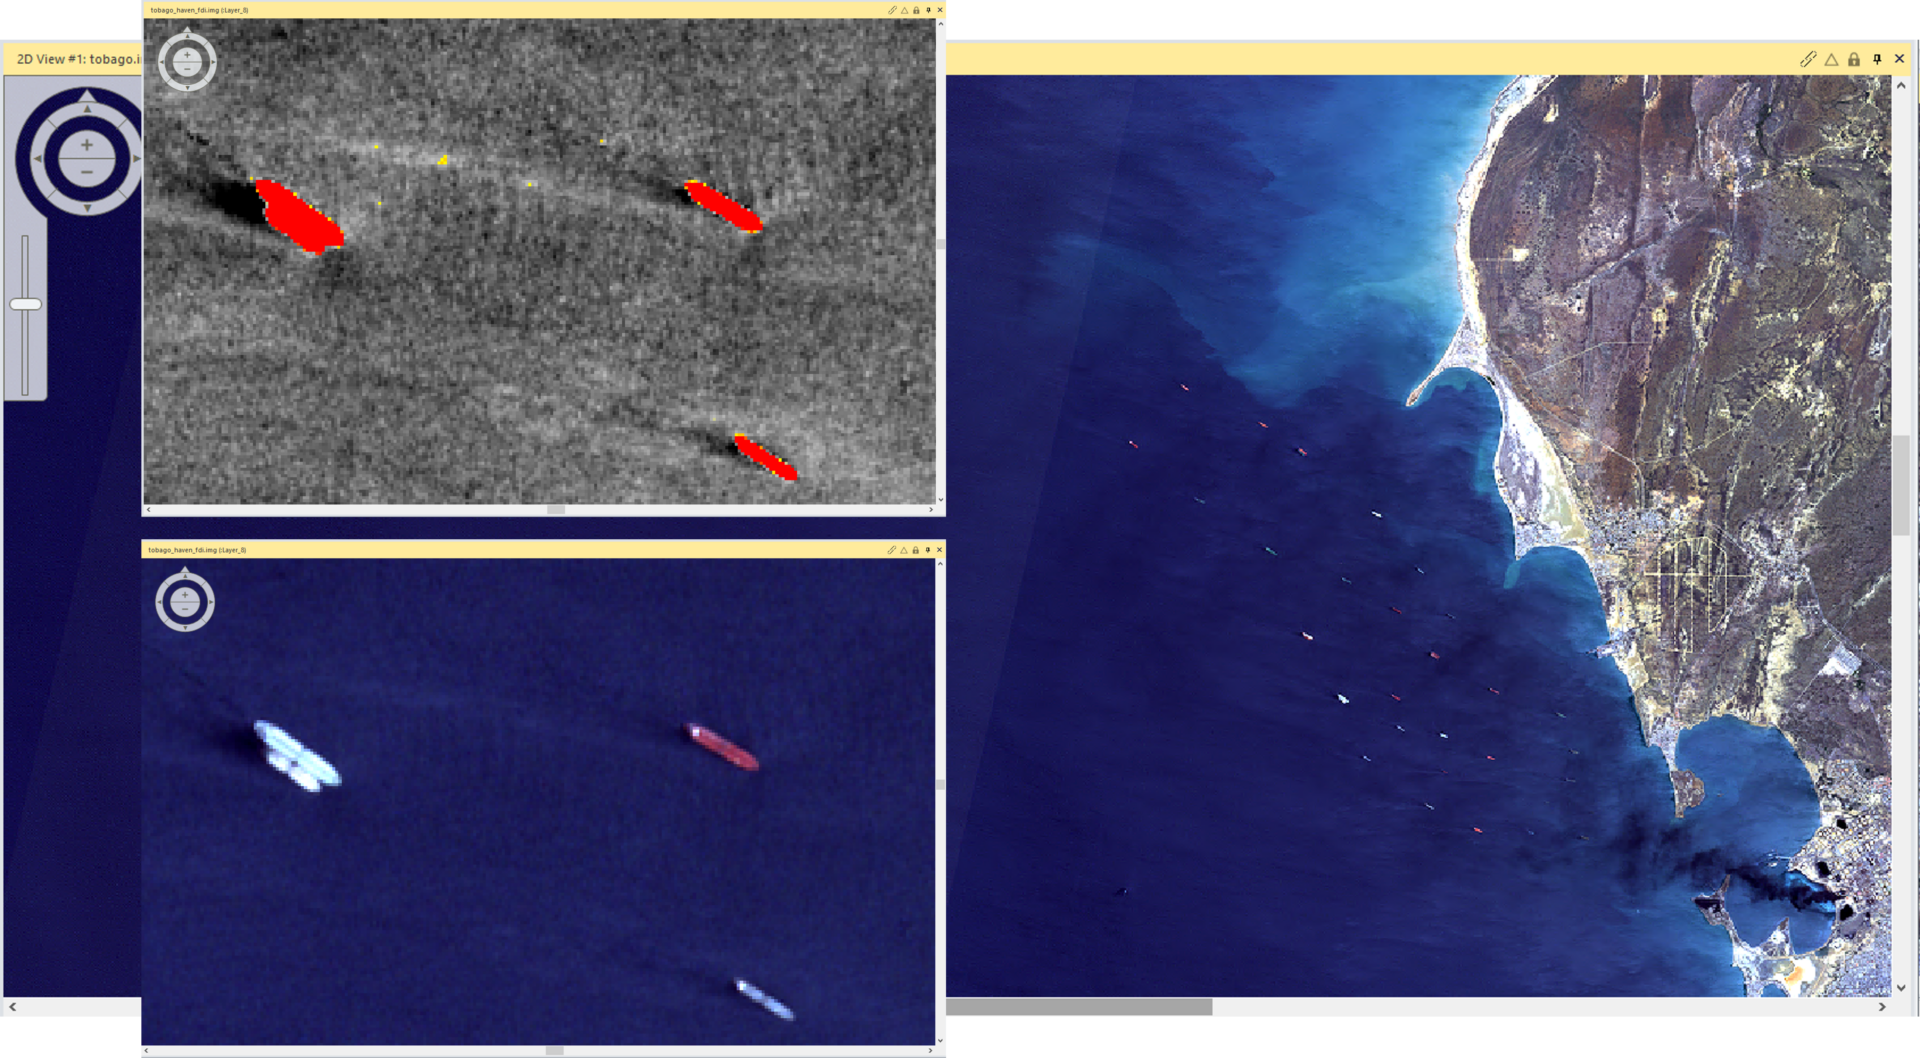
If you zoom in on the image, it becomes even clearer: if we look closely, we can see patches of plastic waste in that beautiful blue sea. Waste that is being carried by ocean currents toward one of the plastic garbage patches in the oceans.
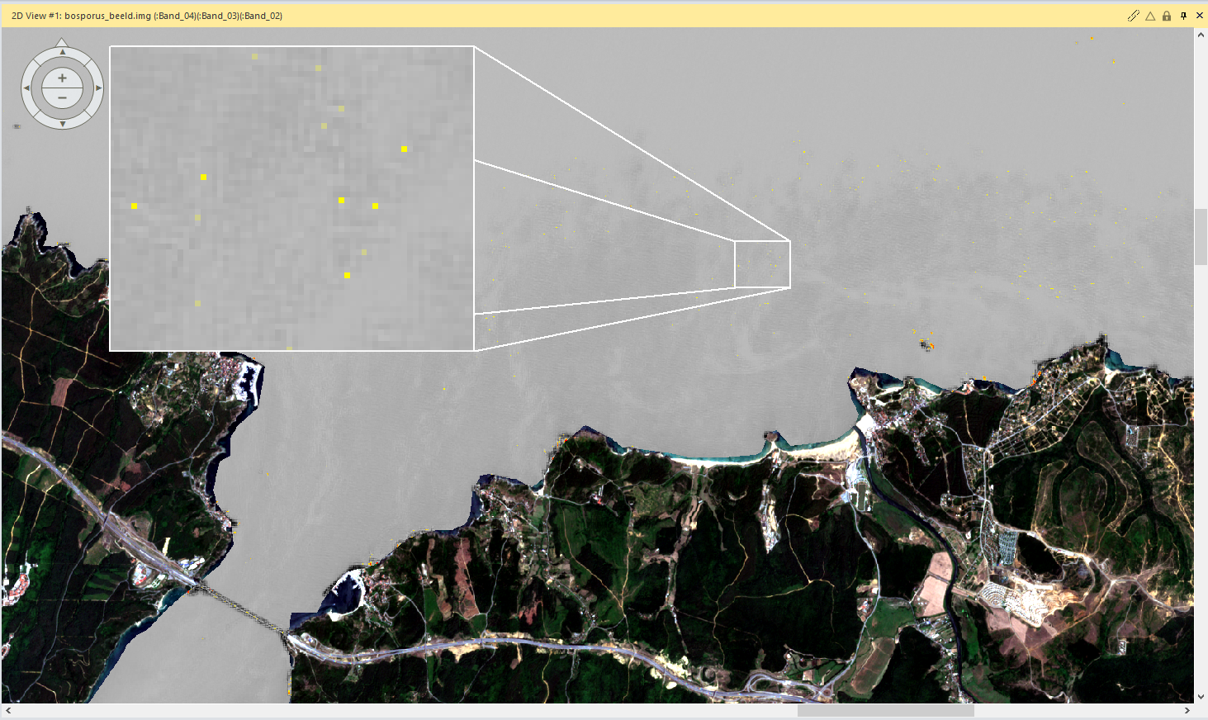
We see the same phenomenon in the Bosporus; here, too, we see “yellow” patches that consist largely of plastic waste.
It’s actually quite alarming; we all know that plastic in the environment is definitely not good. When we walk down the street, we often see plastic littering the ground. Plastic that eventually ends up in the ocean via ditches and rivers. Not only that, but there’s so much plastic that a satellite orbiting 786 km above Earth can detect it. How many more elephants will be lost?
More information
Harald is a Business Consultant at IMAGEM. He bridges the gap between business, sales, and technology, and focuses on delivering value to the client. He collaborates with developers to create solutions for the public safety and security sector, educational institutions, and digital twins.
Would you like to learn more about this topic? Send Harald an email or send a message via our contact form.

Harald Görtz
Business Consultant