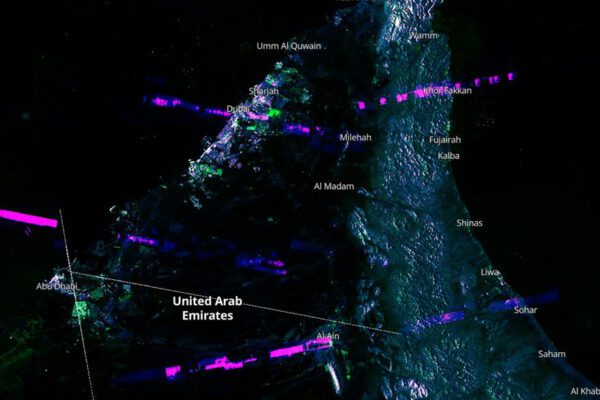

But what is the difference? The world around us is constantly changing. Changes over time usually involve the addition or removal of buildings, vegetation, or other infrastructure. These are changes in elevation, color, or spectral reflectance—all of which are good indicators for visualizing these changes. In my previous blog, I used infrared to visualize the fires and burned areas. Now I’m going to use infrared to detect changes. How can we identify the changes between two different points in time? But that’s not all. Do you want to find all the changes? Or would you rather smartly search for the changes you’re interested in?
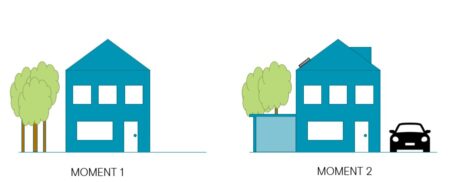
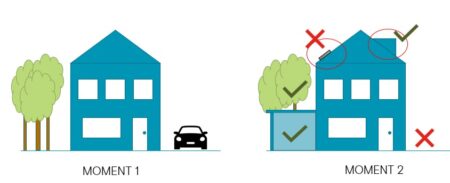
We use indicators such as height, spectral reflectance, location, and combinations thereof to intelligently detect changes. Not just “that” there is a difference between two points in time, but also “what” has changed. For example, an addition to a building. And not just a change in height, but also a change that is attached to the existing building. Vegetation that has changed, such as a tree that has disappeared or fallen over.
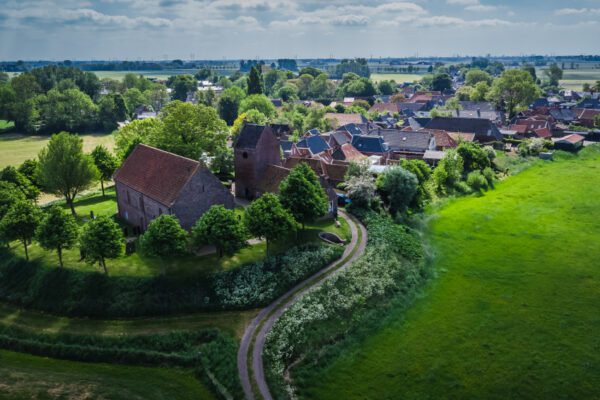
Changes that all involve a difference in height and spectral reflectance. Those are the changes we want to identify. Whether there’s a car parked next to the house or solar panels installed on the roof—we’re not interested in that right now. Even though these are also changes in height and spectral reflectance.
Sensor Fusion
Using sensor fusion, we can therefore create a dataset consisting of multiple layers, which do not necessarily all consist of “images.” For example, a raster file with blue, green, red, and NIR optical bands, and a fifth band that specifies the elevation for each pixel.
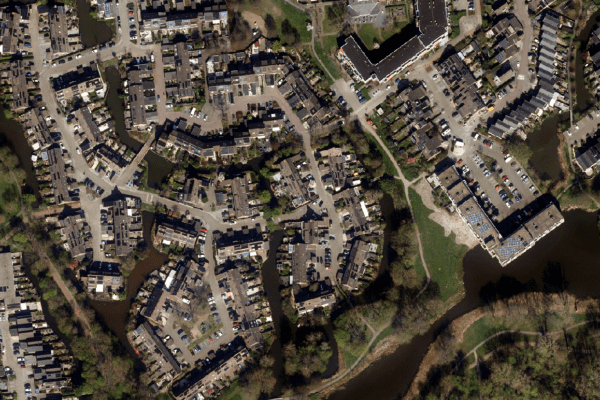
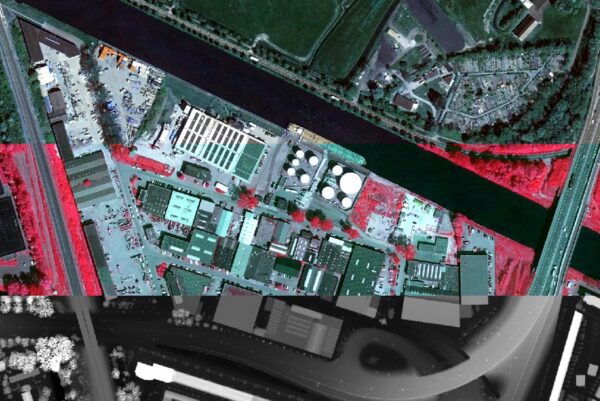
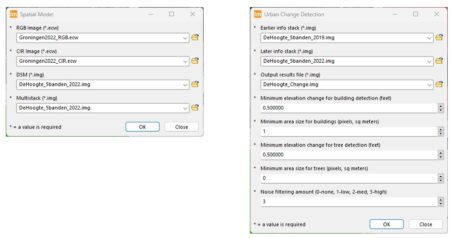
The result of sensor fusion is called an infostack, and you can easily create one in Erdas using the stack layers operator. You specify which input you want on which layer (source), and the software creates the file. As an example, I used the De Hoogte industrial park in Groningen.
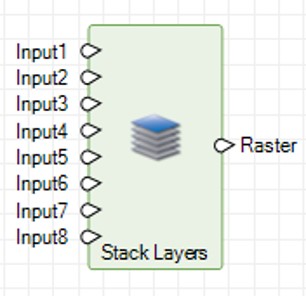
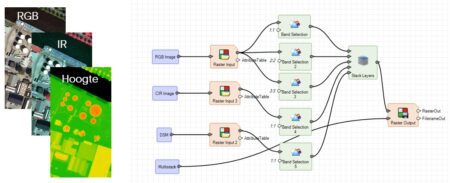
This gives us an info stack with elevation data on band 5 and infrared data on band 4. We use the other bands—1, 2, and 3—for red, green, and blue. In short, for each pixel, we now know not only the color but also the elevation and infrared values. We’ll come back to this later. We then use these two files in the change-detection model to visualize the differences.
It couldn't be easier to create an infostack or run the analysis. Just enter the various parameters, and the model does the rest.
— Harald Gortz, Business Consultant at IMAGEM
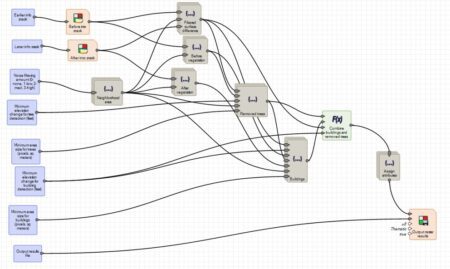
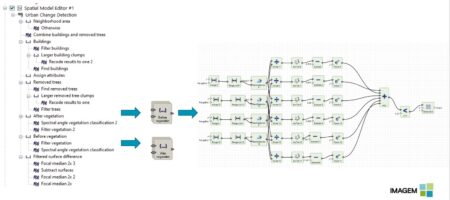
An in-depth look at the model
When we take a closer look at the model and examine the various algorithms, we can see that it involves quite a bit of complex calculation. The formula below is the part that compares the vegetation between the two time points and highlights the differences.
With the push of a button
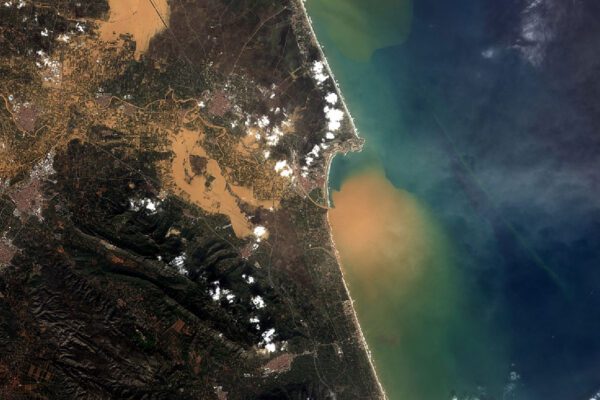
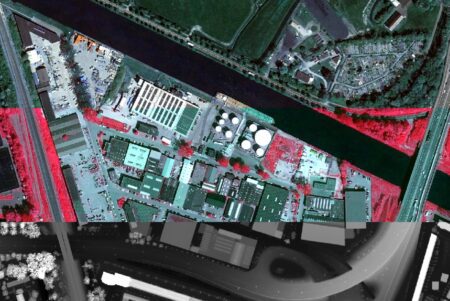
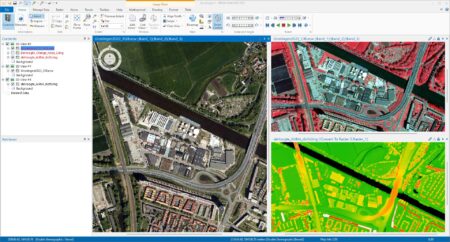
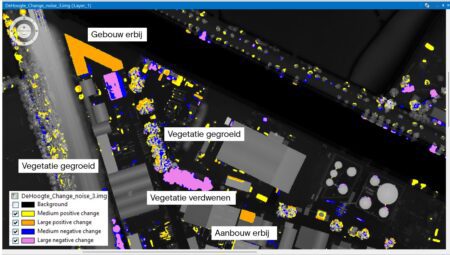
The different colors represent small and large changes, both positive and negative. We can see where construction has taken place and where vegetation has grown. We can also see where vegetation has been pruned or has disappeared. By combining different sources into a single file—an infostack—and then comparing it across two different points in time, we can see the differences.
There has to be a difference! We can also pinpoint where that difference is, almost at the touch of a button within Erdas .
More information
Harald is a Business Consultant at IMAGEM. He bridges the gap between business, sales, and technology, and focuses on delivering value to the client. He collaborates with developers to create solutions for the public safety and security sector, educational institutions, and digital twins.
Would you like to learn more about this topic? Send Harald an email or send a message via our contact form.

Harald Görtz
Business Consultant