
Two hundred and twenty-nine years ago, on June 26, 1794, to be exact, remote sensing was remote sensing being used for military purposes. French General Jean-Baptiste Jourdan utilized a hot-air balloon above the battlefield of Fleurus. The spotters on board signaled the formations and movements of Austrian enemies to their own troops using flags. France won the battle! Today, for example, we use radar to visualize formations and movements. Using two examples—the flooding in Derna, Libya, and the Grand Ethiopian Renaissance Dam (GERD)—I’ll show you a few possibilities of radar and geospatial technology.

Quick insights with remote sensing
remote sensing us remote sensing quickly obtain an overview of large areas, often within just a few hours. A satellite is one of the sensor platforms we can use for this purpose. There are about a thousand satellites currently performing active Earth observation tasks. Of those thousand, eighty have a RADAR sensor on board. RADAR stands for Radio Detection And Ranging. It owes its name and function to the detection of radar wave reflections.
These are electromagnetic waves with wavelengths ranging from millimeters to meters, which are transmitted by a radar antenna and reflected by the targets. The reflected waves are received by the same or a different antenna and processed to extract information such as the distance, speed, shape, size, orientation, and composition of the targets.
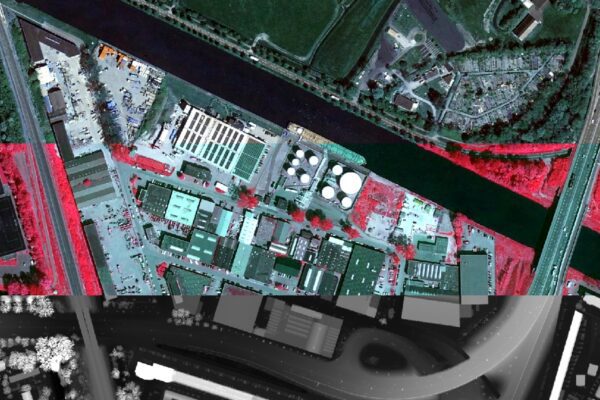
Radar satellites can be used for sophisticated applications, as their sensors detect radar waves. They not only transmit their own waves but can also receive other radar waves. For example, the radar from Patriot or THAAD systems operates at a wavelength to which radar satellites are sensitive. The image above (Figure 1) is a Sentinel-1 SAR image showing radio waves from various air defense radar systems in the United Arab Emirates.
Distinguishing between objects
For remote sensing , we remote sensing SAR, or Synthetic Aperture Radar. What makes this unique is that the SAR pulses are directed sideways (relative to the antenna). As a result, signals are reflected back to the sensor by various objects on Earth at different times.
This allows the objects to be distinguished. Side-looking radar pulses form image lines (i.e., the range dimension). The movement and direction of the sensor, which continuously transmits and receives radar pulses, creates an additional image dimension (i.e., the azimuth dimension). Radar and SAR record the time and strength of a returning pulse, as well as the phase of the microwave. These phase signals produce an interferogram between two SAR data acquisitions.
Simply put, a radar image allows us to identify not only the difference in elevation per pixel but also the difference in reflected energy. This enables us to visualize changes in the terrain’s roughness, relief, and moisture levels. Another advantage of radar is that it can penetrate clouds, fog, dust, and vegetation. Radar can be used both during the day and at night. It is particularly efficient for imaging and detection.
With radar, we can keep an eye on you. You can run, but you can't hide!
— Harald Gortz, Business Consultant | IMAGEM
The flooding in Derna, Libya
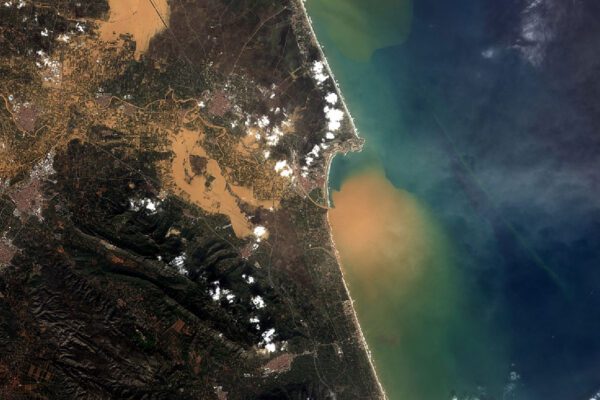
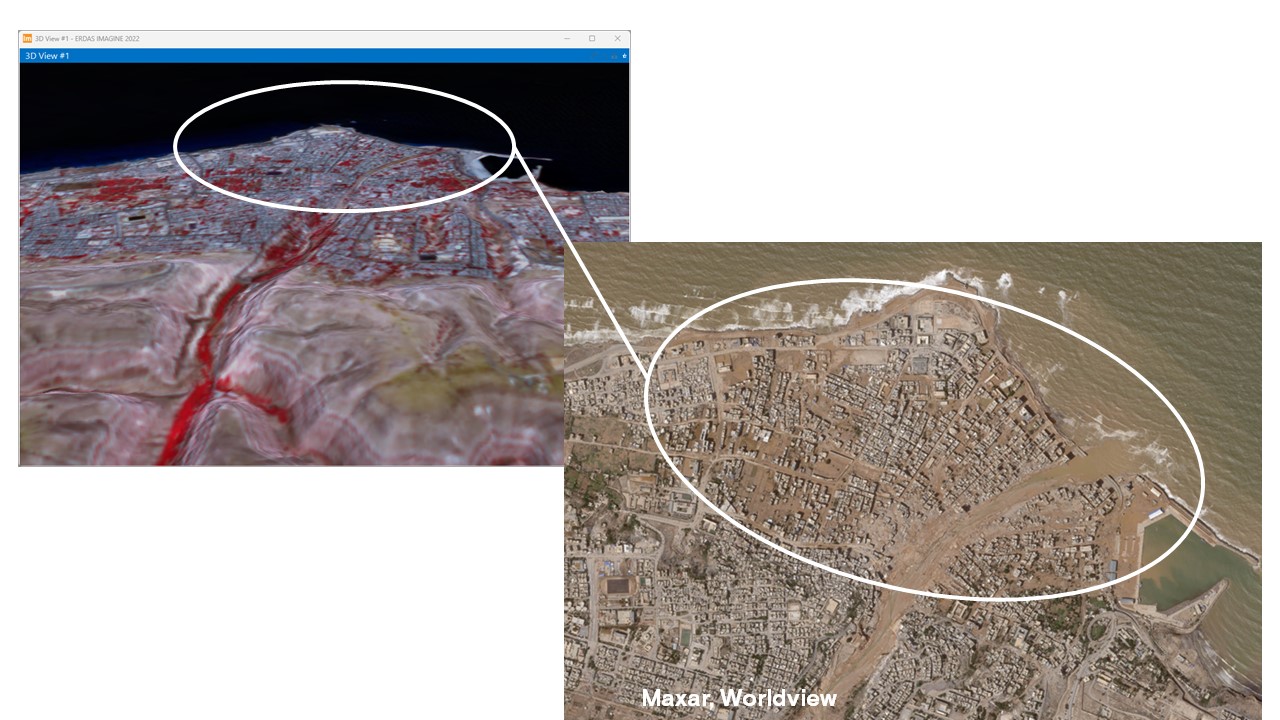
Derna, Libya: 18,000 to 20,000 people lost their lives. Using radar data (Sentinel-1), it is not only possible to visualize the damage (Figure 2). It also provides insight into why this flood was so disastrous. You can create a 3D elevation model from radar data. I created a radar elevation model and overlaid the multispectral image from Sentinel 2 on top of it. You can immediately see why Derna didn’t stand a chance—the Wadi Derna flows directly through the town of Derna!
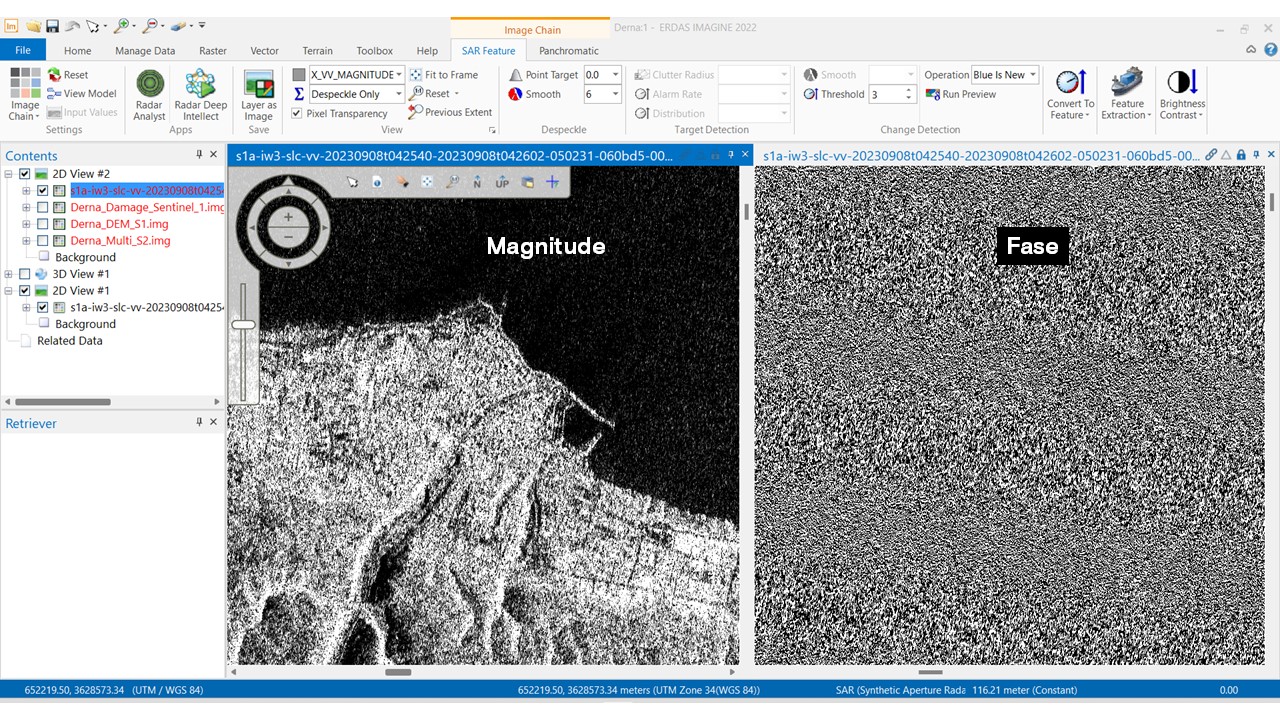
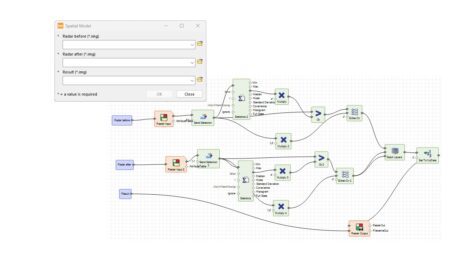
Using radar images taken before and after the flood—specifically, images from September 8 and 13—we can visualize the flood’s impact. Both radar images contain information on magnitude (the strength of the reflection) and phase (the point in the wave at which the signal was received). Both images (Figure 3) are monochrome; in this image, we can recognize Derna and the coastline in the magnitude image. The phase image, on the right, is actually unrecognizable to us as humans, but for the software, Erdas , it is perfect data!
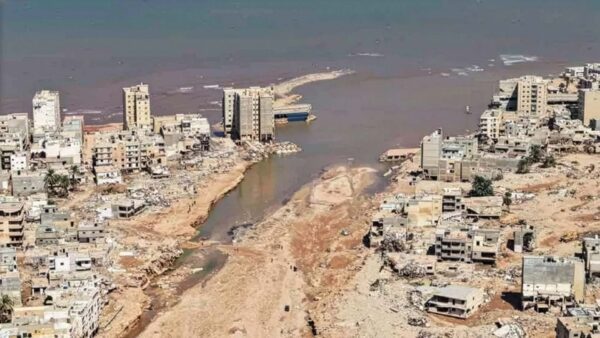
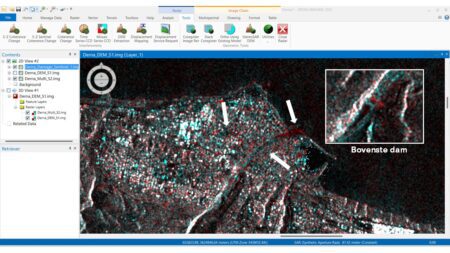
The result (Figure 5) is a color image in which blue and red values represent the changes. In the inset, I have marked the upper dam, which has completely collapsed. It is clearly visible that the water rushed forcefully right through Derna. How is this possible?
Damage model
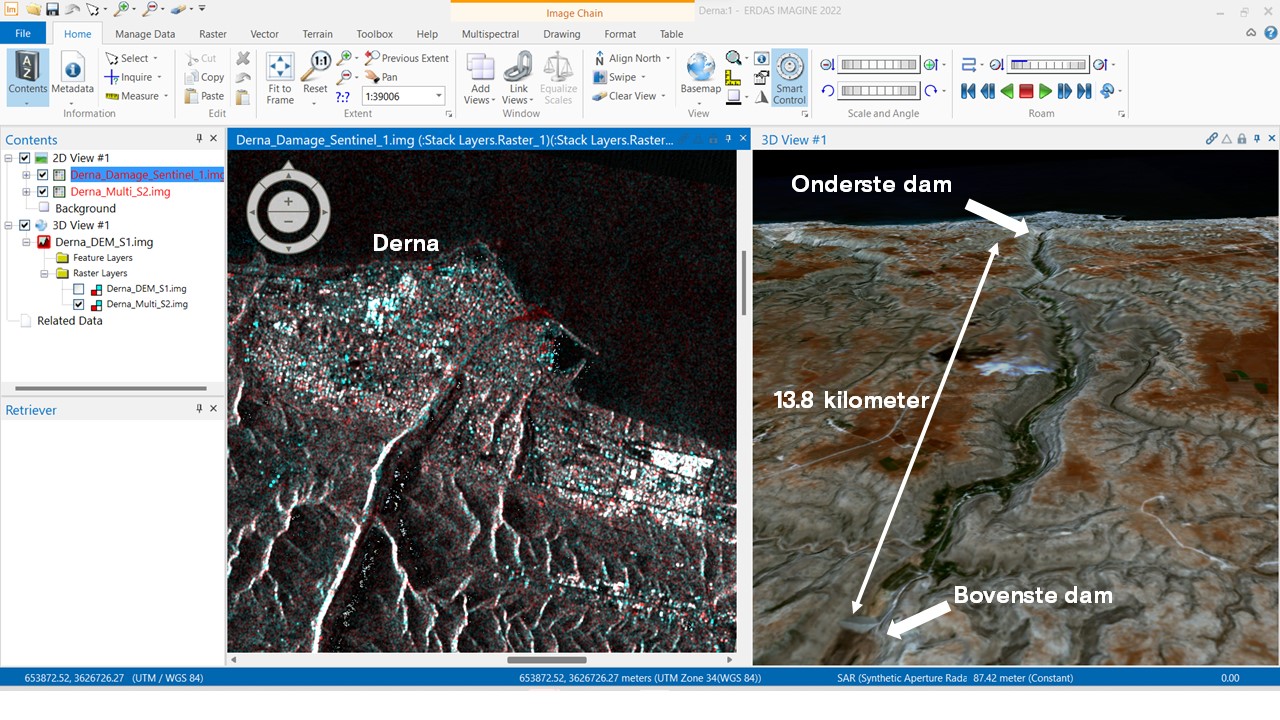
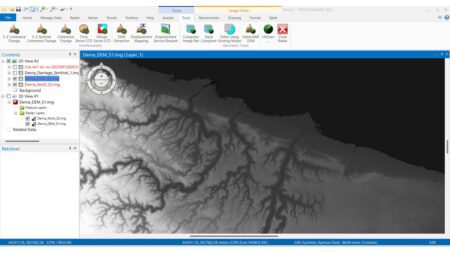
To clarify this, I created a digital elevation model (Figure 6) of Derna, also based on the same radar data.
I then rendered this elevation model as a relief map and in 3D. In the 3D section, I overlaid a Sentinel-2 image—a multispectral image—of the Wadi Derna in false infrared. False infrared allows us to clearly visualize the vegetation (which is then shown in red tones).
Wadi Derna
The result speaks for itself: the Wadi Derna flows directly into Derna. Beyond the upper dam, in the direction of Derna, there is mainly vegetation. There was nothing to slow down or obstruct the flow of water when the upper dam broke.
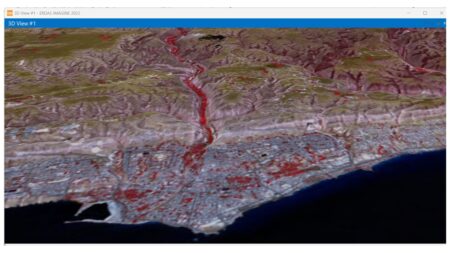
Derna is located at the end of Wadi Derna. The upper dam, at an elevation of 190 meters, broke; the lower dam is 13.8 kilometers further on. With a drop of 158 meters over 13.8 kilometers, the gradient is 11.4 meters per kilometer. By comparison, the Meuse River has a gradient of 0.5 meters per kilometer. As we can see in the image below, the force of the water flow cut straight through Derna and swept away everything in the lower-lying area. The expanding water flow then rendered the rest of that section of Derna uninhabitable.
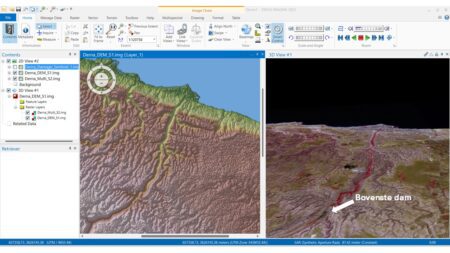
Viewed in 3D (Figure 9) from the sea side, it is even more clearly visible. The enormous mass of water had no choice but to flow through the wadi practically straight toward Derna without any obstacles. With disastrous consequences!
With two radar images, we can do more than just highlight the differences between two points in time. We can also map the terrain, regardless of the time of day, night, or weather conditions.
The Grand Ethiopian Renaissance Dam (GERD)
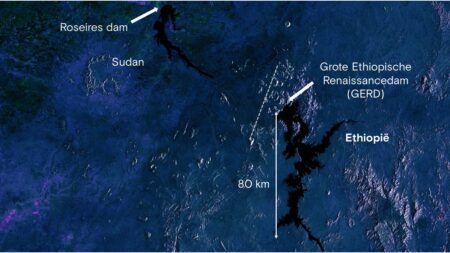
GERD is also a good example of the benefits of radar imagery. Synthetic Aperture Radar (SAR) effectively captures terrain roughness. In other words, inland water bodies are clearly distinguishable as large black spots. This distinction is best seen when using the polarization of the radar image to create a color image. This is available as a standard feature within Erdas .
That image (Figure 10) clearly shows just how vast the GERD Basin is.
It’s also immediately clear why the GERD is causing tensions between Ethiopia, Sudan, and Egypt. Right on the Sudanese side lies the Roseires Dam, a hydroelectric power plant with a maximum capacity of 280 megawatts. The GERD is expected to generate over 6,000 megawatts of power! In addition, Sudan and Egypt are concerned about the water supply from the Blue Nile.
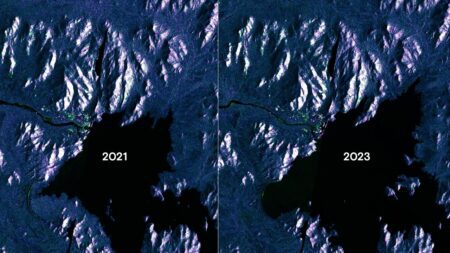
This is clearly evident in the images from 2021 to 2023. In addition to the clear expansion of the GERD basin, we also see that the flow of water toward Sudan has decreased by half.
Livelihood security
Both in terms of the economy (electricity supply) and in terms of water for domestic use and irrigation, we can see that GERD could pose a threat to Sudan and Egypt. As reported in the news:
It is the most intractable dispute to date between Egypt, Sudan, and Ethiopia, and is now the most complex and potentially most destabilizing interstate freshwater conflict in the Middle East and North Africa.
— Harald Gortz, Business Consultant | IMAGEM
Operational awareness, terrain classification, long-term monitoring, damage assessment. Remote sensing support and clarity; whether it’s cloudy or clear, day or night, there’s always a sensor available to capture imagery. Imagery that can be analyzed within Erdas at the touch of a button, providing clarity. With radar, we can keep watch. You can run, but you can’t hide!
More information
Harald is a Business Consultant at IMAGEM. He bridges the gap between business, sales, and technology, and focuses on delivering value to the client. He collaborates with developers to create solutions for the public safety and security sector, educational institutions, and digital twins.
Would you like to learn more about this topic? Send Harald an email or send a message via our contact form.

Harald Görtz
Business Consultant